

Order a report
Custom-made industry research, company ratings, competitor analysis


Changes to legislation on public procurements
On July 1, 2019, the Federal Law №71-FZ of 01.05.2019, with amendments that improve the contract system of public procurement, enters into force.
The amendments prescribe the following:
- procurement planning by only time-schedules, excluding procurement plans;
- maintaining a register of procurement participants by operators of electronic trading platforms;
- reduction from 10 to 1 day of the obligatory period between making changes to a time-schedule and placing notices of procurement;
- increase up to 300 million rubles of initial or maximum prices of contracts, admitting a possibility of conducting of electronic auctions with a shorter bidding period and, up to 2 billion rubles - during construction, reconstruction, major repairs, demolition of construction projects;
- banning on advance payments by conclusion of contracts with procurement participants who have offered a contract price, being lower by 25% or more from the initial or maximum one;
- provision of documents that substantiate compliance with additional requirements for procurement participants accredited at e-trading platforms;
- right to conclude a contract with procurement participants, who have been assigned the second number following the results of competitive procurement, in cases of termination of contracts with the winners of such procurement;
- right to make procurement for one unit of goods, works or services, regardless of the objects of procurement, if it is not possible to determine the volume of goods, works or services at the time of purchase;
- possible change in the material terms of contracts for the construction, reconstruction, major repairs and demolition of construction projects, for works on the preservation of cultural heritage objects in the event of emergency. In particular, an increase in the price up to 10% and a one-time extension of the terms of execution of contracts without an increase in their price in case of payment of the relevant penalties by contractors, in the event of their fault;
- eliminating the need for contractors to post reports on individual stages of the execution of contracts for construction works or for the preservation of cultural heritage objects, as well as in cases where the contract price is more than 1 billion rubles.
Information on all contacts and procurement, including archival one, is available in full for subscribers of the Information and Analytical system Globas.
Trends of buildings construction
Information Agency Credinform presents a review of activity trends of the largest buildings construction companies in Russia.
Construction companies with the largest annual revenue (TOP-10 and TOP-1000) have been selected for the analysis, according to the data from the Statistical Register for the latest available accounting periods (2015 — 2017). The analysis was based on the data from the Information and Analytical system Globas.
Net asset value indicates fair value of corporate assets and is calculated annually as assets on balance less company’s liabilities. Net asset value is negative (insufficiency of property) if liabilities are larger than the property value.
Average net assets of TOP-1000 companies tended to decrease during the last decade (Picture 1).
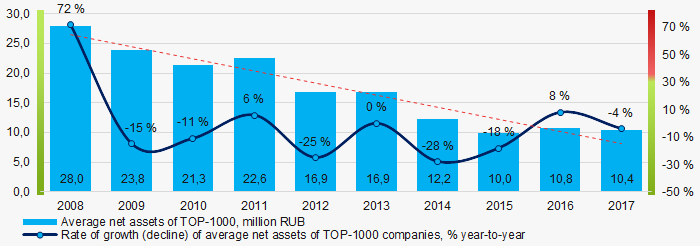 Picture 1. Change in average net assets of buildings construction companies in 2008 – 2017
The share of TOP-1000 companies with insufficiency of property tends to increase within the last 3 years (Picture 2).
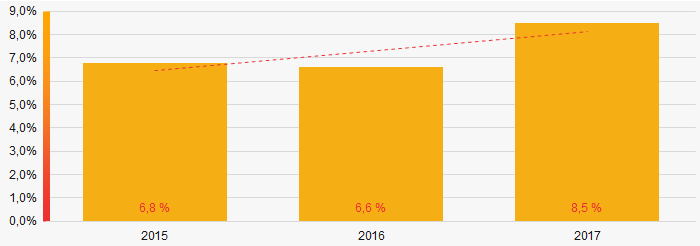 Picture 2. Share of TOP-1000 companies with negative value of net assets in 2015-2017
Sales revenue
In 2017 sales revenue of 10 industry leaders amounted to 18% of total revenue of TOP-1000 companies (Picture 3). This is an indicator of a high level of competition within the industry.
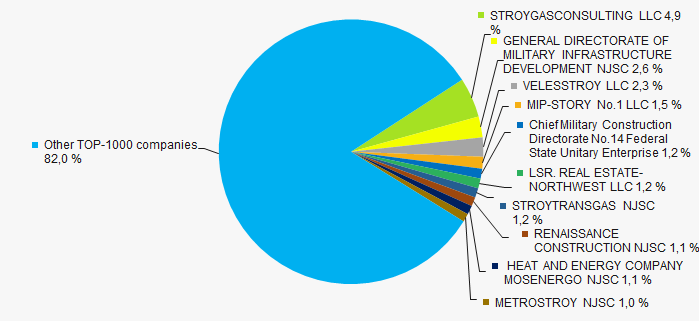 Picture 3. TOP-10 companies by their share in 2017 total revenue of TOP-1000 companies
In general, average industry revenue tends to decrease during the decade (Picture 4).
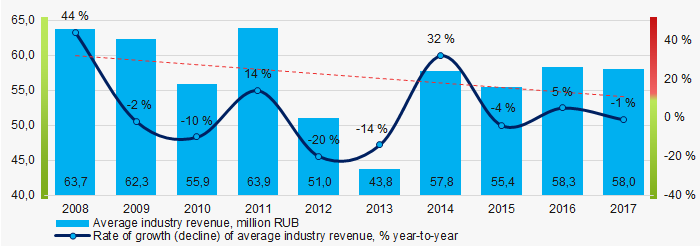 Picture 4. Change of average industry revenue of TOP-1000 buildings construction companies in 2008 – 2017
Profit and loss
During the decade average industry net profit tended to decrease (Picture 5).
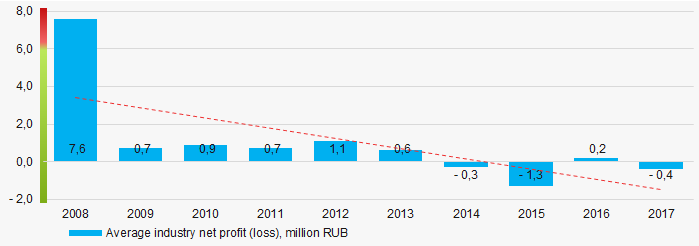 Picture 5. Change in average industry net profit of buildings construction companies in 2008 — 2017
During the last 3 years average industry net profit of TOP-1000 companies increased, as well as average net loss (Picture 6).
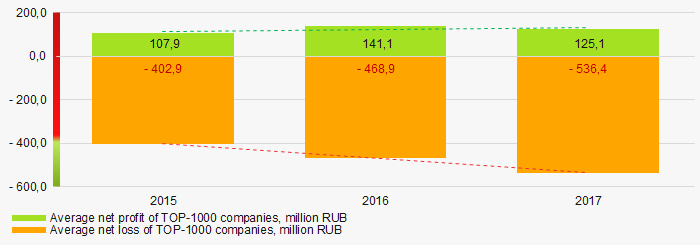 Picture 6. Change in average net profit and loss of TOP-1000 companies in 2015 — 2017
Key financial ratios
During the last decade average values of total liquidity ratio of TOP-1000 companies were below the recommended value — from 1,0 to 2,0, tending to increase (Picture 7).
Total liquidity ratio (a ratio of current assets to current liabilities) reveals the sufficiency of a company’s funds for meeting its short-term liabilities.
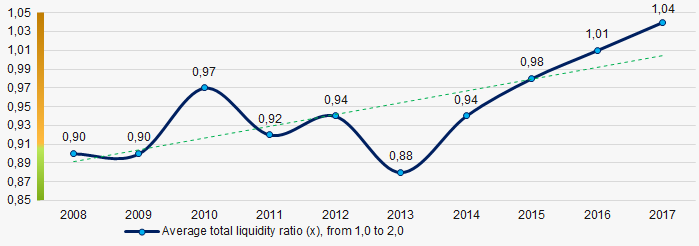 Picture 7. Change in average values of total liquidity ratio of TOP-1000 buildings construction companies in 2008 — 2017
During the last decade, average industry values of return on investment ratio tended to decrease (Picture 8).
It is a ratio of net profit to total equity and noncurrent liabilities, and it demonstrates benefit from equity engaged in business activity and long-term raised funds of the company.
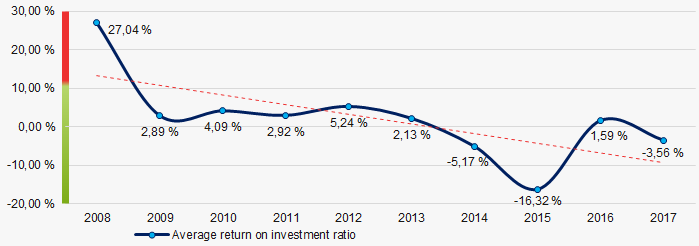 Picture 8. Change in average values of return on investment ratio of TOP-1000 buildings construction companies in 2008 — 2017
Assets turnover ratio is a ratio of sales revenue to average total assets for the period, and it measures resource efficiency regardless of the sources. The ratio indicates the number of profit-bearing complete production and distribution cycles per annum.
During the last decade, this activity ratio tended to decrease (Picture 9).
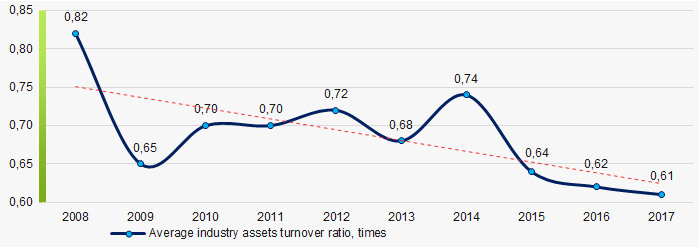 Picture 9. Change in average values of assets turnover ratio of TOP-1000 buildings construction companies in 2008 — 2017
Small business
46% of TOP-1000 companies are included in the Register of small and medium-sized enterprises of the Federal Tax Service of the Russian Federation. In general, their share in total revenue of TOP-1000 in 2017 amounted to 17% that is lower than the average national value (Picture 10).
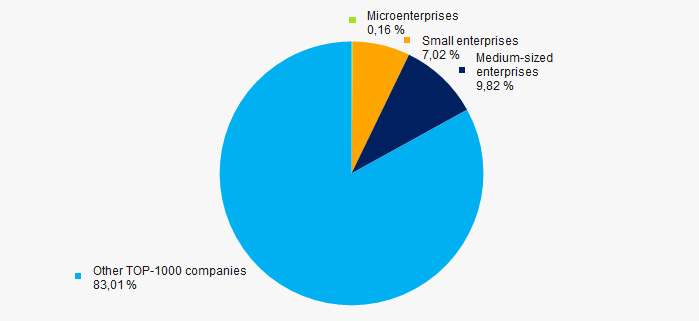 Picture 10. Shares of small and medium-sized enterprises in TOP-1000 companies' revenue, %
Key regions of activity
TOP-1000 companies are unevenly located throughout Russian territory and are registered in 76 regions. Over 66% of their revenue are concentrated in Moscow, St. Petersburg and the Moscow region (Picture 11).
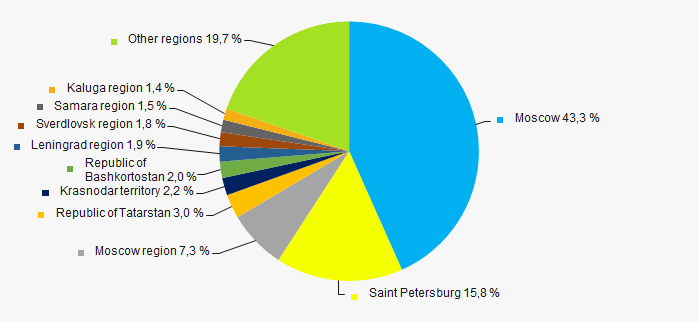 Picture 11. Revenue of TOP-1000 companies by Russian regions
Financial position score
Assessment of financial state of TOP-1000 companies indicates that most of the companies have an above average financial position (Picture 12).
 Picture 12. TOP-1000 companies by their financial position score
Solvency index Globas
The majority of TOP-1000 companies have got a superior, high, strong or medium Solvency index Globas, that indicates their capability to meet liabilities timely and in full (Picture 13).
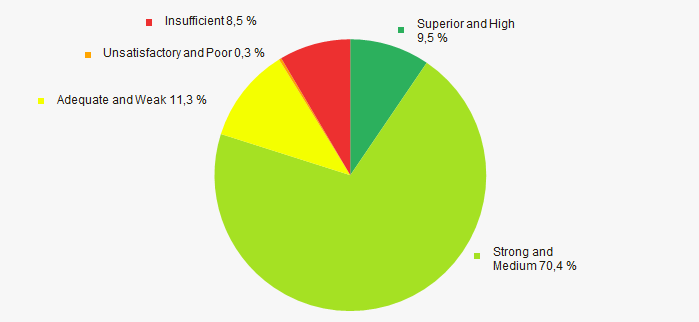 Picture 13. TOP-1000 companies by Solvency index Globas
According to the Federal Statistics Service, the share of buildings construction companies in the national revenue from sale of goods and services in 2018 amounted to 1,67%.
Conclusion
A comprehensive assessment of the largest buildings construction companies in Russia, that considers key indexes, financial figures and ratios, is indicative of negative trends in the industry (Table 1).
| Trends and assessment factors | Relative share of the factor, % |
| Rate of growth (decline) of average industry net assets | |
| Increase/ Decrease of share of companies with negative net assets | |
| Rate of growth (decline) of average revenue | |
| Level of competition/ monopolization | |
| Rate of growth (decline) of average net profit (loss) | |
| Increase/ Decrease of average net profit of TOP-1000 companies | |
| Increase/ Decrease of average net loss of TOP-1000 companies | |
| Increase/ Decrease of average total liquidity ratio | |
| Increase/ Decrease of average return on investment ratio | |
| Increase/ Decrease of average assets turnover ratio | |
| Share of small and medium-sized business within the region by revenue over 22% | |
| Regional concentration | |
| Financial standing (majority share) | |
| Solvency index Glogas (majority share) | |
| Average factors' value | |
![]() positive trend (factor),
positive trend (factor), ![]() negative trend (factor).
negative trend (factor).