
Order a report
Custom-made industry research, company ratings, competitor analysis


Expenditure of non-profit enterprises
In accordance with the article 2 of the Federal law as of 12.01.1996 №7-FL, non-profit enterprises are not created to make profit. This fact gives no opportunity to use the profitability criterion as an essential for evaluation of activity of an enterprise.
The analysis of the total expenditure is another way, which allows evaluating the ranges of an enterprise’s activity and effectiveness of its work in comparison to profit.
Information agency Credinform represents a ranking of non-profit enterprises in Russia. The enterprises (TOP-10 and TOP-1000) with the largest total expenditure were selected for the ranking, according to the data from the Statistical Register and Federal Tax Service for the latest available accounting periods (2017 – 2019). Then they were compared to the net profit (loss) values (Table 1). The selection and analysis were based on the data from the Information and Analytical system Globas.
In order to get the most comprehensive and fair picture of the financial standing of an enterprise, it is necessary to pay attention to all the combination of financial indicators and company’s ratios.
| Name, INN, region, type of activity | Total expenditure, million RUB | Net profit (loss), million RUB | Solvency index Globas | ||||
| 2017 | 2018 | 2019 | 2017 | 2018 | 2019 | ||
| 1 | 2 | 3 | 4 | 5 | 6 | 7 | 8 |
| The Roscongress Foundation INN 7706412930 Moscow, organisation of conventions and trade shows |
9 772,9 | |
|
573,0 | |
|
196 High |
| SPSnabK SPSSPK EKOPTITSA INN 4813014007 Lipetsk region, manufacture and preserving of poultry meat |
5 656,8 | |
|
23,8 | |
|
281 Medium |
| ANO KIT KI INN 7734266656 Moscow, research and experimental development on social sciences and humanities |
1 082,9 | |
|
11,6 | |
|
271 Medium |
| POLICLINIC OF OAO GAZPROM INN 7728159705 Moscow, general medical practice activities |
3 620,3 | |
|
-270,3 | |
|
248 Strong |
| MOSCOW UNIVERSITY FOR INDUSTRY AND FINANCE SYNERGY INN 7729152149 Moscow, higher education |
2 727,9 | |
|
41,2 | |
|
248 Strong |
| MOSCOW SCHOOL OF MANAGEMENT SKOLKOVO INN 5032180980 Moscow region, higher education |
2 484,6 | |
|
-15,4 | |
|
296 Medium |
| ANO SBERBANK UNIVERSITY INN 7736128605 Moscow, other professional education |
3 698,3 | |
|
68,9 | |
|
249 Strong |
| PO STUPINSKOE RAIPO INN 5045018663 Moscow region, retail sale in non-specialised stores with food, beverages or tobacco predominating |
3 772,2 | |
|
-15,4 | |
|
304 Adequate |
| ChU NEFROSOVET INN 7730184402 Moscow, human health activities |
2 488,7 | |
|
5,2 | |
|
280 Medium |
| ChU CHUZ KB RZHD-MEDITSINA G. CHELYABINSK INN 7451207988 Chelyabinsk region, hospital activities |
1 803,2 | |
|
39,0 | |
|
218 Strong |
| Average value for TOP-10 | 3 710,8 | |
|
61,6 | |
|
|
![]() improvement compared to prior period,
improvement compared to prior period, ![]() decline compared to prior period
decline compared to prior period
Seven enterprises increased their total expenditure in 2019 comparing to the prior period. Four enterprises showed losses in 2019.
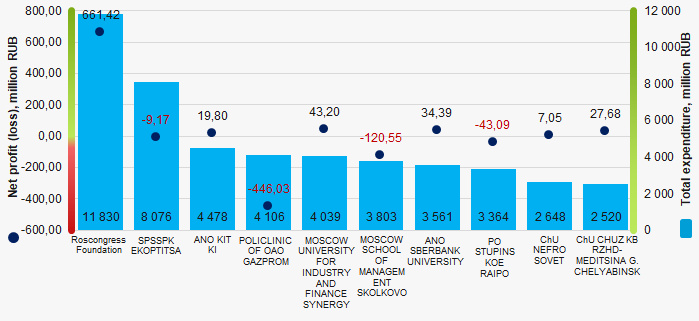 Picture 1. Total expenditure and net profit (loss) of TOP-10 non-profit enterprises
During 6 years, the average industry values of the total expenditure had a trend to increase (Picture 2).
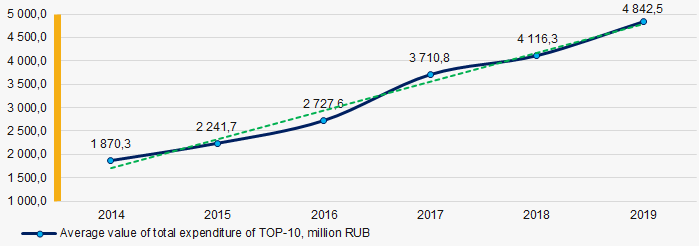 Picture 2. Change of average values of total expenditure of TOP-10 non-profit enterprises in 2014 – 2019
ТОP-10 of electrical goods distributors
Information agency Credinform has prepared a ranking of Russian household appliances wholesalers. The largest enterprises (TOP-10 and TOP-100) in terms of annual revenue were selected according to the data from the Statistical Register and the Federal Tax Service for the available periods (2017-2019). Then the companies were ranged by return on assets ratio (Table 1). The company selection and analysis were based on the data from the Information and Analytical system Globas.
Return on assets (%) is calculated as the relation of the sum of net profit and interest payable to the total assets value of a company and shows how many monetary units of net profit are earned by every unit of total assets.
The ratio characterizes the effectiveness of using by the company of its resources. The higher is the ratio value, the more effective is business, that is the higher the return per every monetary unit invested in assets.
However, it is necessary to take into account that the book value of assets may not correspond to their current market value. For example, under the influence of inflation, the book value of fixed assets will increasingly be underestimated in time, that will lead to an overestimation of the return on assets. Thus, it is necessary to take into account not only the structure, but also the age of the assets.
It should be also taken into account the dynamics of this indicator. Its consistent decline indicates a drop in asset utilization.
The calculation of practical values of financial indicators, which might be considered as normal for a certain industry, has been developed and implemented in the Information and Analytical system Globas by the experts of Information Agency Credinform, taking into account the actual situation of the economy as a whole and the industries. In 2019 the average industry practical value of return on assets ratio for the household appliances wholesalers was from 0 to 11,11 %%.
For the most full and fair opinion about the company’s financial position the whole set of financial indicators and ratios should be taken into account.
| Name, INN, region | Revenue, million RUB | Net profit (loss), million RUB | Return on assets,% | Solvency index Globas | |||
| 2018 | 2019 | 2018 | 2019 | 2018 | 2019 | ||
| 1 | 2 | 3 | 4 | 5 | 6 | 7 | 8 |
| LLC ELECTROLUX RUS INN 7804159731 Moscow |
|
|
|
|
|
|
218 Strong |
| LLC PHILIPS INN 7704216778 Moscow |
|
|
|
|
|
|
258 Medium |
| LLC WHIRLPOOL RUS INN 7717654289 Moscow |
|
|
|
|
|
|
246 Strong |
| LLC TRADE HOUSE ABSOLUT INN 7726600963 Moscow |
|
|
|
|
|
|
260 Medium |
| LLC KHASKEL INN 7719269331 Moscow region |
|
|
|
|
|
|
195 High |
| LLC TFN INN 7727696432 Moscow |
|
|
|
|
|
|
233 Strong |
| JSC SONY ELECTRONICS INN 7703001265 Moscow |
|
|
|
|
|
|
228 Strong |
| LLC ELEKTROSISTEM INN 7704844420 Tver region |
|
|
|
|
|
|
304 Adequate |
| LLC DISRTIBUTION CENTRE INN 5047067909 Moscow region |
|
|
|
|
|
|
251 Medium |
| LLC RBT Company INN 7452030451 Chelyabinsk region |
|
|
|
|
|
|
214 Strong |
| Average value for TOP-10 companies | |
|
|
|
|
|
|
| Average value for TOP-1000 companies | |
|
|
|
|
|
|
| Average industry value | |
|
|
|
|
|
|
![]() growth of indicator in comparison with prior period,
growth of indicator in comparison with prior period, ![]() decline of indicator in comparison with prior period
decline of indicator in comparison with prior period
The return on assets value of all TOP-10 companies is in the range of average industry practical value.
The average value of return on assets for TOP-10 companies is lower than TOP-1000 and average industry value: in 2019, three companies improved the results. At the same time, only one company showed the decrease in revenue and two companies demonstrated the increase in net profit.
In general, during the last 10 years, the average industry indicators of return on assets ratio were within the practical value. (Picture 1). The companies showed sufficient efficiency in use of their resources, with exception of 2018.
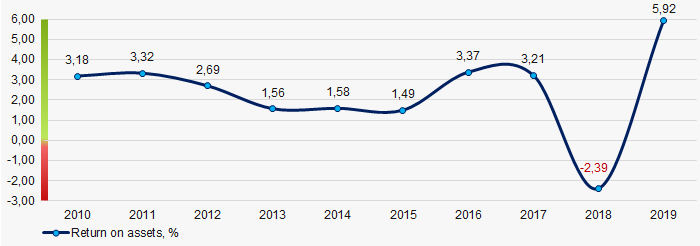 Picture 1. Change in average industry values of return on assets of household appliances wholesalers in 2010 – 2019