Contract system slows down national projects: who is to blame and what to do
To implement the ambitious program “National projects 2019-2024”, record-high 18,1 trillion RUB are planned to be allocated from the federal and regional budgets.
By September, only 46% out of 1,7 trillion RUB received for national projects were committed.
The primary obstacle to implement the projects is unfinished mechanism of budget allocation through the public procurement system.
Customers cancel procurement procedures
From the implementation of development programs as part of national projects concerning almost all segments of domestic economy and public life, the problem of procurement inefficiency has become acute. Bureaucracy in public procurement is very strong. The procurement system is highly complicated for both customers and suppliers. Principles of budgetary savings when selecting the supplier lead to decline in quality of supplied goods or services. As a result, customers interrupt procurement due to unavailability of suitable vendors, or they failing to conduct procurement within the legal deadline due to complex paperwork.
In January-June 2019, the customers placed procurement notices under the 44-FL with a total value of 4,4 trillion RUB, that is by 59% higher than in 2018. At the same time, total volume of concluded contracts amounted to 3,1 trillion RUB, that is by 6% lower that in the first six months of 2018.
There is a paradoxical situation of allocating big funds by the government, but they do not serve for the economy being committed by the customers too slowly through no fault of their own.
Fair suppliers refused to participate in procurement
Economic sense of procurement for potential participants is declining due to unavailability of attractive and detailed investment projects, as well as due to price reduction policy in determining the winner.
Electronic auction is the most popular way to determine the supplier by the lowest total contract price as one of the key criteria. Total volume of such procurement type in January-June 2019 amounted to 3,3 trillion RUB, or 76% of total procurement volume.
In business community, there is a strong belief that demands of customers artificially limit the pool of participants. Documents are prepared for pre-selected suppliers, and there is very little chance to win for other suppliers.
Affiliation of the customer with one of the participants and strict contract schedule do not boost the confidence in feasibility of cooperation. Some companies do not participate in procurement because of obligatory securing the contract, and not all small companies are able to pay large amount for placing the bid.
Significant quick corrections to the contract system
The existing procurement system is criticizing by both business community and highest authorities. In this regard, the legislator began to make quick corrections to the 44-FL, aimed at simplification of public procurement system and attracting new potential participants including those of small enterprises. Changes will affect both customers and suppliers.
For example, small business will be allowed to provide bank guarantee instead of withdrawing funds from turnover to the special account to secure the large bid. The customers will be able to conduct short procedure procurement without duplicate workflow and reporting.
The list of most significant changes in procurement procedures is presented in Table 1.
Table 1. Major changes to the 44-FL with effect in 2019
| Issue | Old rules | New rules |
| Excessive workflow | The customer prepared duplicate documents - schedule and procurement plan, where it was required to specify the goals and rationale for procurement | Only procurement schedule not containing goals and rationale for procurement |
| Blocking funds on a special account in procurement exceeding 1 million RUB | Securing the bid with funds in a special account | Securing the bid with funds in a special account or bank guarantee |
| Financial capabilities of the business to secure the application are not taken into account | Small business (SMP) secured bids for participation in the procurement along with other participants | Securing an application for SMP is not required if there is experience in the execution of contracts over the past three years |
| Amount of the security for the bid for SMEs is artificially high | Calculated from the initial (maximum) contract price | Calculated from the final price of the contract, which is usually lower than the initial |
| Repeated procurement in case of contract failure | Customer is required to conduct new procurement | It is allowed to enter into contract with the second participant without new procurement |
| Minor amounts of procurement from a single supplier | Maximum price from a single supplier amounted to 100 thousand RUB | Price from a single supplier was increased 3 times - up to 300 thousand RUB |
| Low speed of procurement arrangement | Notice of the start of procurement was placed 10 days after changes in the procurement schedule | Procurement notice is published the day after changes in the schedule |
| Inability to make large purchases under the expedited procedure | For compact auctions, the initial contract price was limited to the amount of 3 million RUB | For short auctions, the contract price bar has been increased to 300 million RUB, for construction - up to 2 billion RUB |
| Necessity of reporting on contract execution | Mandatory required to generate and post reports | Contract performance reporting is canceled |
Conclusion
Despite positivity of changes, the measures taken are insufficient to make the contract system flexible and simplified. Main shortcomings of public procurement under the 44-FL have not been resolved: principle of reducing prices for receiving the order and mechanism for determining the initial contract price by the customer. It is unprofitable for companies to participate in procurement, as they have to sell products / services at below cost or even lower. The customer is forced to save allocated funds, and quality in most procedures takes second place.
Transformation of the contract system must facilitate access to procurement to a wider range of participants, speed up the timing of competitive procedures, and relieve customers from excessive reporting.
The economy receives huge funds. The active participation of entrepreneurs in procurement is essential for successful implementation of national projects and new impetus for economic growth in the country.
Whether national projects will be implemented and whether the economy can develop successfully depends largely on the will of the senior officials of the country.
Trends in microlending
Information agency Credinform has prepared a review of trends of the largest microlending companies.
Companies granting loans and other credits, and being largest (TOP-10 and TOP-1000) in terms of annual revenue were selected for the analysis according to the data from the Statistical Register for the latest available periods (2015-2017). The analysis was based on the data of the Information and Analytical system Globas.
Net assets are total assets less total liabilities. This indicator reflects the real value of the property of an enterprise. When the company’s debt exceeds the value of its property, the indicator is considered negative (insufficiency of property).
The largest company in term of net assets is LLC IST-KAPITAL, INN 7801503432. In 2018, net assets value of the company exceeded 14 billion RUB.
The lowest net assets volume among TOP-100 belonged to LLC AKTIV S, being in process of reorganization in the form of acquisition since 23.08.2019, INN 7826718207. In 2018, insufficiency of property of the company was indicated in negative value of -1,1 billion RUB.
Covering the ten-year period, the average net assets values have a trend to increase (Picture 1).
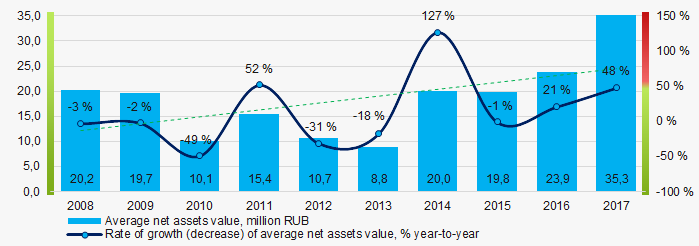 Picture 1. Change in average net assets value in 2008 – 2017
The shares of TOP-1000 companies with insufficient property have trend to decrease over the past five years (Picture 2).
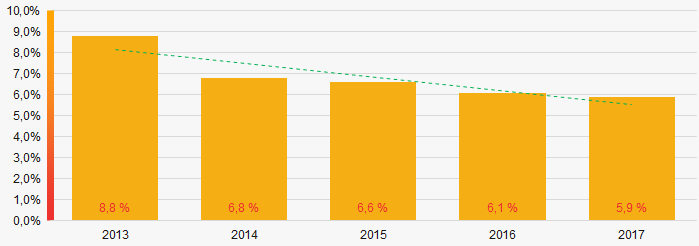 Picture 2. Shares of companies with negative net assets value in TOP-1000, 2013-2017
Sales revenue
In 2017, total revenue of 10 largest companies of was almost 49% of TOP-1000 total revenue (Picture 3). This testifies high level of monopolization in the industry.
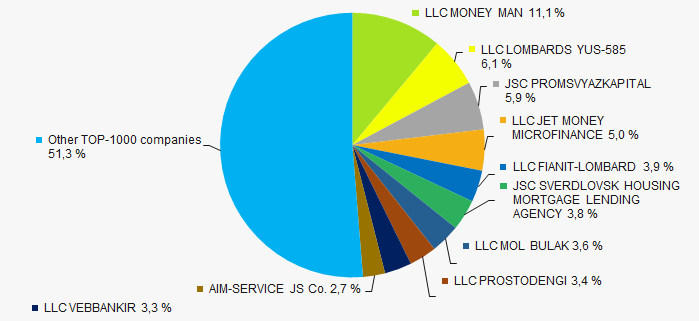 Picture 3. Shares of TOP-10 companies in TOP-1000 total profit for 2017
Covering the ten-year-period, there is an increase in industry average revenue (Picture 4).
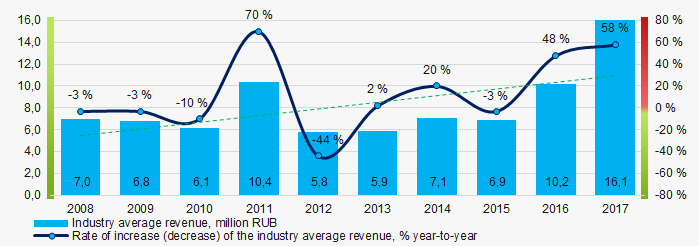 Picture 4. Change in industry average net profit in 2008-2017
Profit and loss
The largest company in term of net profit is LLC AKVA-KAPITAL, INN 7825123775. The company’s profit for 2018 exceeded 7,1 billion RUB.
Over the ten-year period, there is a trend to increase in average net profit (Picture 5).
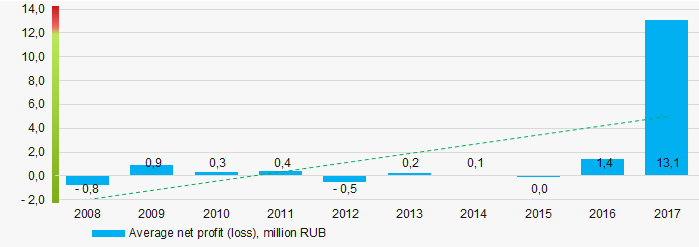 Picture 5. Change in industry average net profit values in 2008-2017
For the five-year period, the average net profit values of TOP-1000 companies increase with the average net loss value also having the increasing trend (Picture 6).
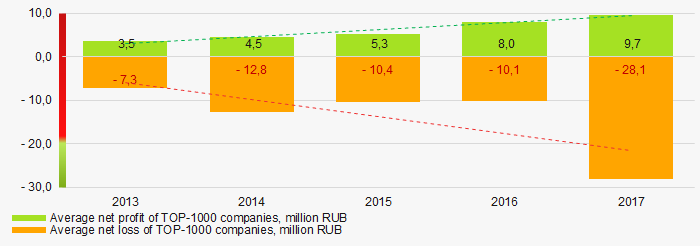 Picture 6. Change in average net profit and net loss of ТОP-1000 in 2015 – 2017
Key financial ratios
For the ten-year period, the average values of the current liquidity ratio were often below the recommended one - from 1,0 to 2,0 with a trend to increase (Picture 7).
Current liquidity ratio (current assets to short-term liabilities) shows the sufficiency of company’s assets to repay on short-term liabilities.
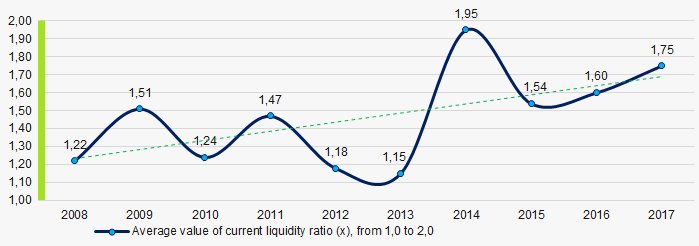 Picture 7. Change in industry average values of current liquidity ratio in 2008 – 2017
For the ten-year period, the average values of ROI ratio were on a quite high level with a trend to increase (Picture 8).
ROI ratio is calculated as net profit to sum of shareholders equity and long-term liabilities, and shows the return of equity involved in commercial activities and long-term borrowed funds.
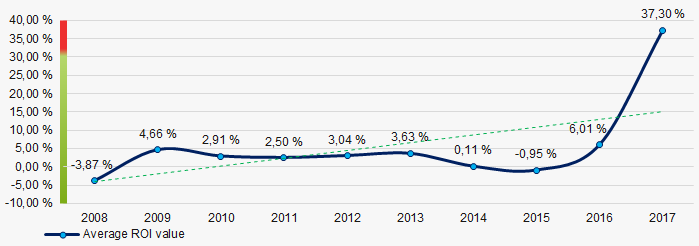 Picture 8. Change in average values of ROI ratio in 2008 – 2017
Assets turnover ratio is the ratio of sales revenue and company’s average total assets for a period. It characterizes the effectiveness of using of all available resources, regardless the source of their attraction. The ratio shows how many times per year the full cycle of production and circulation is performed, generating the corresponding effect in the form of profit.
For the ten-year period, business activity ratio demonstrated the increasing trend (Picture 9).
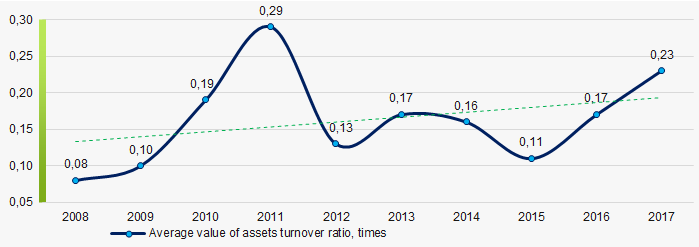 Picture 9. Change in average values of assets turnover ratio in 2008 – 2017
Small enterprises
92% companies of TOP-1000 are registered in the Register of small and medium-sized enterprises of the Federal Tax Service of the Russian Federation. At the same time, their share in total revenue for 2017 amounted to almost 36% that is significantly higher than the national average figure (Picture 10).
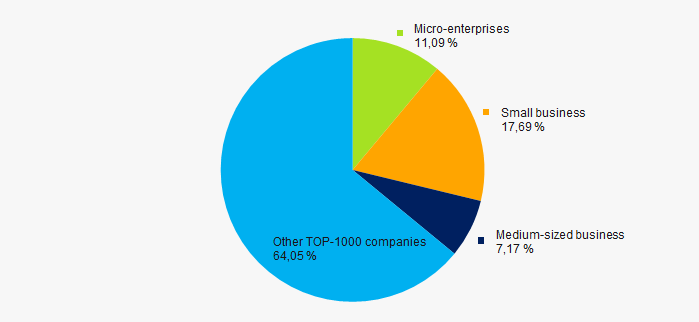 Picture 10. Shares of small and medium-sized enterprises in TOP-100, %
Main regions of activity
Companies of TOP-1000 are registered in 72 regions of Russia and located across the country quite unequally. Over 52% of their turnover is concentrated in Moscow and Saint Petersburg (Picture 11).
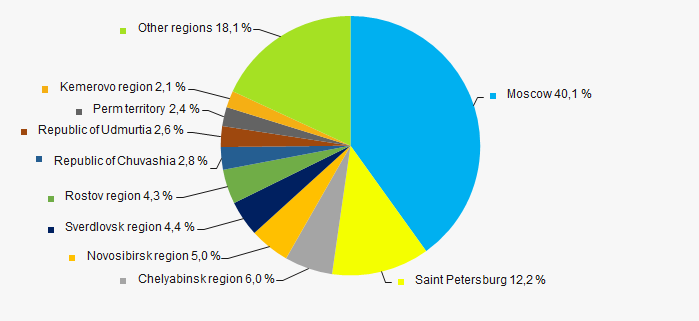 Picture 11. . Distribution of TOP-100 revenue by regions of Russia
Financial position score
Assessment of the financial position of TOP-1000 companies shows that the majority of them have financial position above average (Picture 12).
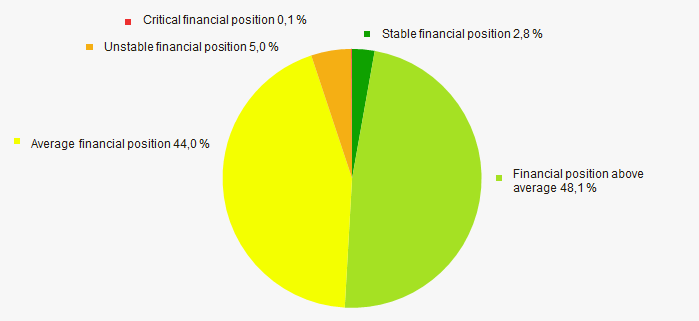 Picture 12. Distribution of TOP-100 companies by financial position score
Solvency index Globas
Most of TOP-1000 companies got Superior / High and Strong / Medium index Globas. This fact shows their ability to meet their obligations fully (Picture 13).
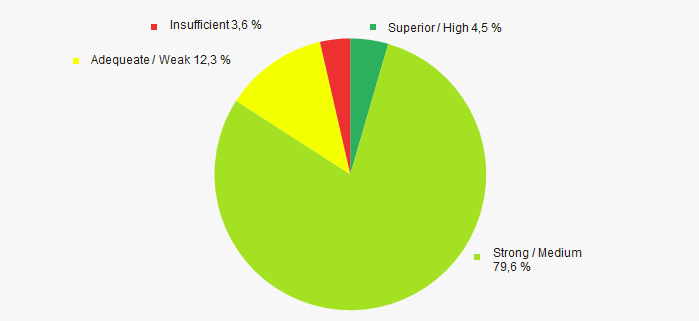 Picture 13. Distribution of TOP-1000 companies by solvency index Globas
Conclusion
Complex assessment of activity of the largest Russian microlending companies, taking into account the main indexes, financial ratios and indicators, demonstrates the prevalence of positive trends (Table 1).
| Trends and evaluation factors | Relative share of factors, % |
| Rate of growth (decline) in the average size of net assets |  10 10 |
| Increase / decrease in the share of enterprises with negative values of net assets |  10 10 |
| Rate of growth (decline) in the average size of revenue |  -10 -10 |
| Level of competition |  10 10 |
| Rate of growth (decline) in the average size of profit (loss) |  10 10 |
| Growth / decline in average values of companies’ net profit |  10 10 |
| Growth / decline in average values of companies’ net loss |  -10 -10 |
| Increase / decrease in average values of total liquidity ratio |  10 10 |
| Increase / decrease in average values of return on investment ratio |  10 10 |
| Increase / decrease in average values of asset turnover ratio, times |  10 10 |
| Share of small and medium-sized businesses in the region in terms of revenue being more than 22% |  10 10 |
| Regional concentration |  -10 -10 |
| Financial position (the largest share) |  10 10 |
| Solvency index Globas (the largest share) |  10 10 |
| Average value of relative share of factors |  5,7 5,7 |
 positive trend (factor),
  negative trend (factor).