
Order a report
Custom-made industry research, company ratings, competitor analysis


Product profitability of the largest Russian grain manufacturers
Information agency Credinform presents a ranking of the largest Russian grain manufacturers in terms of product profitability ratio.
The companies with the highest volume of revenue were selected for this ranking according to the data for the latest available period (2014). These enterprises were ranked by decrease in product profitability ratio. (Table 1).
Product profitability (%) is calculated as the ratio of sales profit to expenses from ordinary activities. In general, profitability reflects the economic efficiency of production. Product profitability analysis allows us to make a conclusion whether output of one or another product is reasonable. There are no prescribed values for indicators of this group, because they vary strongly depending on the industry.
| Name, INN, region | Net profit 2014, mln RUB | Revenue of 2014, mln RUB | Revenue of 2014 to 2013, % | Product profitability, % | Solvency index Globas-i® |
|---|---|---|---|---|---|
| LLC AVANGARD-AGRO ORYOL INN 5722033156 Oryol region |
1 036,9 | 2 607,0 | 214 | 65,60 | 226 High |
| LLC BIOTON Company INN 6367044243 Samara region |
1 221,0 | 2 830,5 | 136 | 62,20 | 155 The highest |
| LLC AVANGARD-AGRO-KURSK INN 4607004691 Kursk region |
379,0 | 1 555,0 | 150 | 58,31 | 255 High |
| LLC GRAIN COMPANY NOVOPETROVSKAYA INN 2349031389 Krasnodar territory |
215,6 | 1 252,6 | 246 | 56,56 | 247 High |
| JSC KUBAN AGRO INN 2356045713 Krasnodar territory |
1 110,2 | 5 166,5 | 154 | 46,24 | 210 High |
| JSC AGROFIRMA RILSKAYA INN 4620008021 Kursk region |
240,1 | 1 304,7 | 124 | 24,62 | 235 High |
| LLC KURSK AGROAKTIV INN 4611010458 Kursk region |
-448,8 | 1 631,8 | 226 | 23,82 | 327 Satisfactory |
| LLC ORLOVSKIY LIDER INN 5706004687 Oryol region |
34,0 | 1 387,9 | 112 | 9,75 | 550 Unsatisfactory |
| LLC AGRO-INDUSTRIAL CORPORATION AST COMPANY M INN 7721147115 Moscow |
64,7 | 5 170,7 | 163 | 2,65 | 199 The highest |
| SUE AGRICULTURAL ENTERPRISE MACHINERY AND TECHNOLOGICAL STATION TSENTRALNAYA of the Republic of Bashkortostan INN 245022178 the Republic of Bashkortostan |
9,0 | 1 433,5 | 109 | -1,20 | 229 High |
LLC AGRO-INDUSTRIAL CORPORATION AST COMPANY M and JSC KUBAN AGRO have got the highest revenue in the industry for 2014. According to the product profitability ratio, these enterprises take ninth and fifth places. Shares of each of those in total revenue volume of TOP-10 companies are more than 21%.
LLC AVANGARD-AGRO ORYOL demonstrates the highest product profitability ratio 65,6%.
Following the results of 2014, increase in revenue is observed for all TOP-10 companies, and LLC KURSK AGROAKTIV and LLC ORLOVSKIY LIDER showed decrease in net profit or loss.
SUE AGRICULTURAL ENTERPRISE MACHINERY AND TECHNOLOGICAL STATION TSENTRALNAYA of the Republic of Bashkortostan has got negative value of product profitability ratio.
In general, summarizing the financial and nonfinancial data, eight companies from the TOP-10 list have got the highest or high solvency index Globas-i. This demonstrates their ability to pay off the debts in time and to the full extent.
LLC KURSK AGROAKTIV has got satisfactory solvency index Globas-i due to the information about company being a defendant in debt collection arbitration proceedings, as well as about loss in financial accounts.
LLC ORLOVSKIY LIDER has got unsatisfactory solvency index Globas-i due to the information about bankruptcy claim.
The average product profitability value among TOP-10 companies in 2014 is 34,86%.
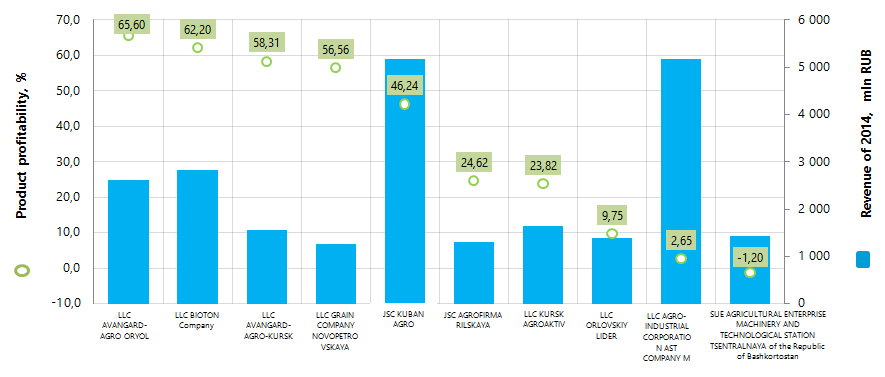
Total revenue volume of TOP-10 companies in 2014 is 23,3 bln RUB, that is 55% higher than in 2013. Total net profit of this group for the same period increased more than double.
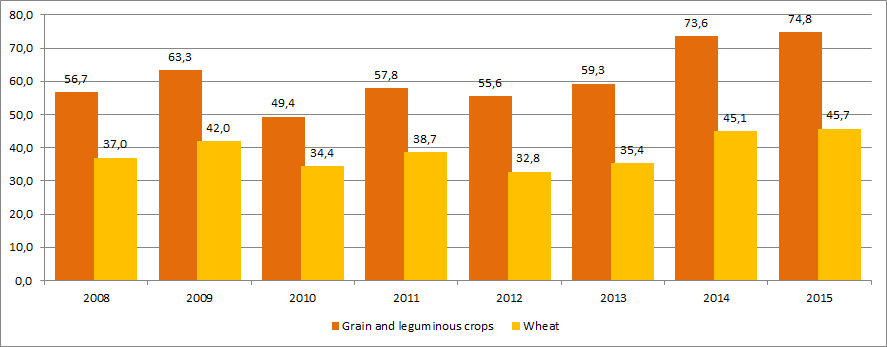
In general, enterprises operate profitably. The industry demonstrates positive dynamics in grain production. According to the data of the Federal State Statistics Service (Rosstat), grain realization by the enterprises of all kinds has been constantly growing since 2012. (Picture 2).
According to recent data of Rosstat, grain and leguminous crops were harvested at farms of all kinds (th tons):
| On August, 1 | On November, 1 | |||
|---|---|---|---|---|
| 2014 | 2015 | 2016 | 2014 | 2015 |
| 35 026,57 | 28 817,64 | 33 756,21 | 105 664,1 | 105 760,2. |
Grain producing companies are located in regions with the best environment for agricultural production. According to the data of the Information and analytical system Globas-i, 100 largest companies are registered in 27 regions in terms of revenue volume for 2014. Most of them are registered in the following regions (TOP-9 regions):
| Region | Number of companies |
|---|---|
| Krasnodar territory | 17 |
| Stavropol territory | 13 |
| Kursk region | 12 |
| Lipetsk region | 7 |
| Oryol region | 6 |
| Belgorod region | 4 |
| Voronezh region | 4 |
| Omsk region | 4 |
| Rostov region | 4 |