
Order a report
Custom-made industry research, company ratings, competitor analysis


Food retail trends
Information agency Credinform represents an overview of food retail trends.
The enterprises with the largest volume of annual revenue (TOP-10 and TOP-30000) were selected for the analysis, according to the data from the Statistical Register for the latest available periods (for 2015 and 2016). The analysis was made on the basis of the data of the Information and Analytical system Globas.
Legal forms
The most spread legal form of companies in food retail is a limited liability company. Consumer society also make a significant part. (Picture 1).
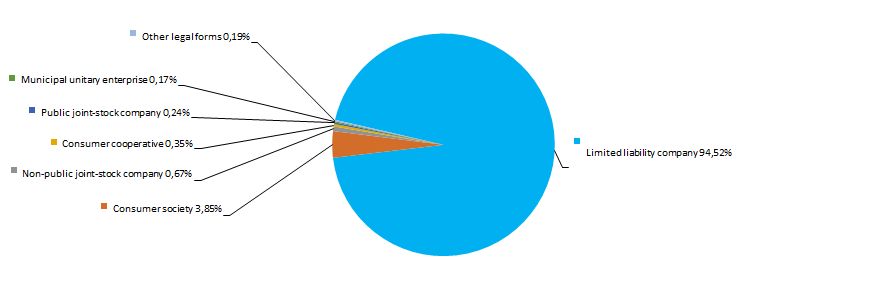 Picture 1. Distribution of TOP-30000 companies by legal forms
Sales revenue
The revenue of 10 industry leaders made 57% of the total revenue of 30000 the largest companies in 2016. It points to a high level of monopolization in the industry. TANDER JSC became the largest company in terms of revenue in 2016 (Picture 2).
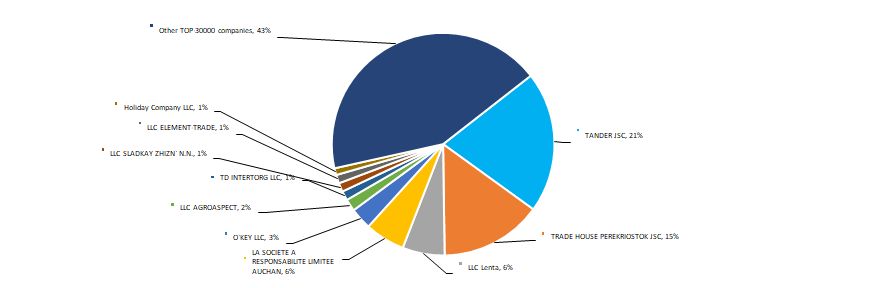 Picture 2. Shares of participation of TOP-10 enterprises in the total revenue of TOP-30000 companies for 2016, %
 The best results in the industry in terms of revenue for the ten-year period were achieved in 2016. During the crisis periods in the economy (in years 2011 and 2013) there was a decline observed in the industry average indicators. (Picture 3).
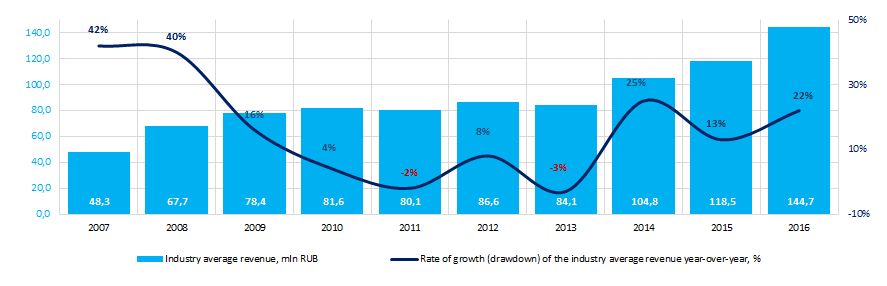 Picture 3. Change in the industry average indicators of companies’ revenue in food retail for 2007-2016
Profit and losses
The volume of profit of 10 industry leaders made 52% of the total profit of TOP-30000 companies in 2016. The leading position in terms of profit volume in 2016 is taken also by TANDER JSC (Picture 4).
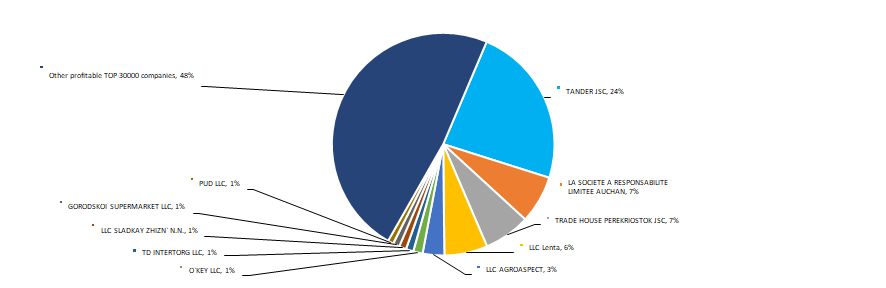 Picture 4. Shares of participation of TOP-10 enterprises in the total volume of profit of TOP-30000 companies for 2016, %
Industry values of the profit indicators of companies in food retail for the ten-year period as a whole have a trend to increase. Decrease in indicators was observed in 2008 and in 2014 against the background of crisis phenomena in the economy. The industry showed the best results in 2016. (Picture 5).
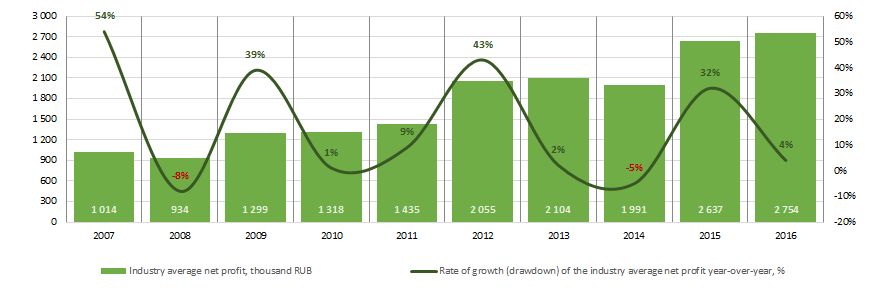 Picture 5. Change in the industry average indicators of profit of companies in food retail in 2007 – 2016
There were 4840 loss-making enterprises in 2015 among TOP-30000 companies. In 2016 their number increased to 5043 or by 4%. At the same time, the average size of their loss increased by 11%. For the rest of TOP-30000 companies the average profit margin reduced by 11% during the same period (Picture 6).
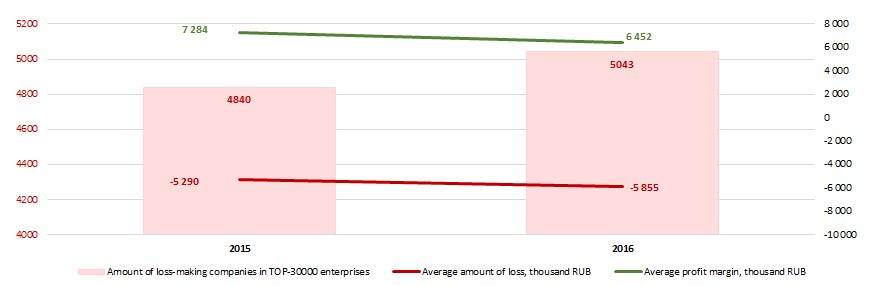 Picture 6. Amount of loss-making companies, average value of loss and profit of TOP-30000 enterprises in 2015-2016
 Key financial ratios
Over the ten-year period the average industry indicators of the total liquidity ratio were within the range of recommended values - from 1,0 to 2,0. (Picture 7).
The total liquidity ratio (the relation of the amount of current assets to short-term liabilities) shows the sufficiency of company’s funds for repayment of its short-term liabilities.
The solvency ratio (the relation of the amount of own capital to the balance sum) shows the company's dependence on external borrowings. Recommended value is > 0.5. The value of the coefficient below the minimum value means a strong dependence on external sources of funds’ receipt.
The experts of the Information agency Credinform, taking into account the actual situation both in the economy as a whole and in sectors, has developed and implemented in the Information and analytical system Globas the calculation of practical values of financial ratios that can be recognized as normal for a particular industry. For food retail companies the practical value of the solvency ratio was from 0,23 to 0,98 in 2016.
Over the ten-year period the industry average indicators of the ratio were below the recommended value and in the interval of practical values, starting from the year 2009 (Picture 7).
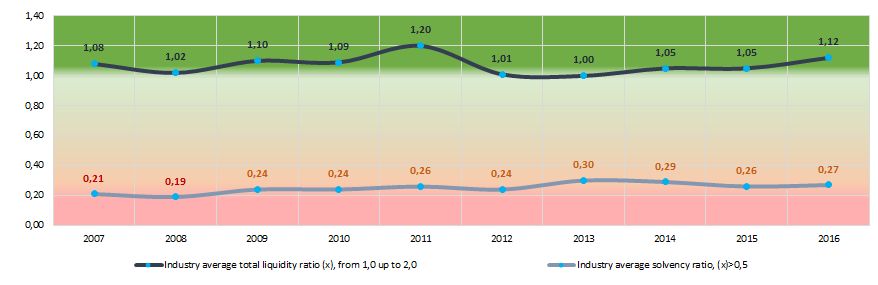 Picture 7. Change in the industry average values of the total liquidity and solvency ratios of food retail companies for 2007 – 2016
There has been an instability observed in indicators of the return on investment ratio during ten years. In periods of crisis phenomena in the economy the indicators decreased (Picture 8). The ratio is calculated as the relation of net profit to the sum of own capital and long-term liabilities and demonstrates the return on the equity involved in the commercial activity and the long-term borrowed funds of an organization.
The indicators of the profitability ratio of products (services) were relatively stable with a downtrend in the same period (Picture 8). The indicators were the highest in the period from 2007 to 2010. The ratio is calculated as the relation of profit from sales to expenses for ordinary activity. In general, profitability reflects the economic efficiency of production.
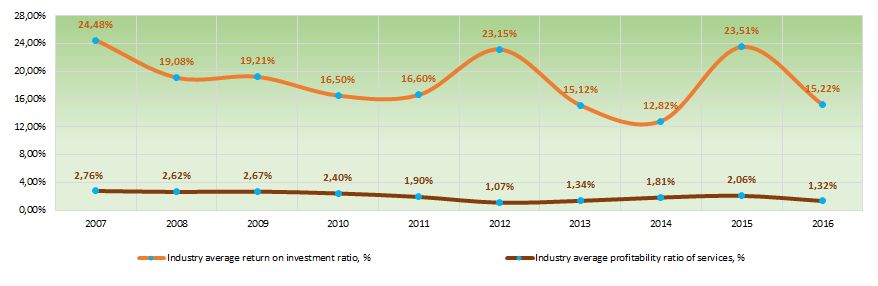 Picture 8. Change in the industry average values of the return on investment and products profitability ratio of food retail companies for 2007 – 2016
 Indicators of the activity ratio over a ten-year period demonstrate a trend to decrease (Picture 9).
Asset turnover ratio is calculated as the relation of sales proceeds to the average value of total assets for a period and characterizes the efficiency of use of all available resources, regardless of the sources of their attraction. The coefficient shows how many times a year a complete cycle of production and circulation is made, yielding profit.
Equity turnover ratio is calculated as the relation of revenue to average annual amount of equity and shows the intensity of use of the whole part of assets.
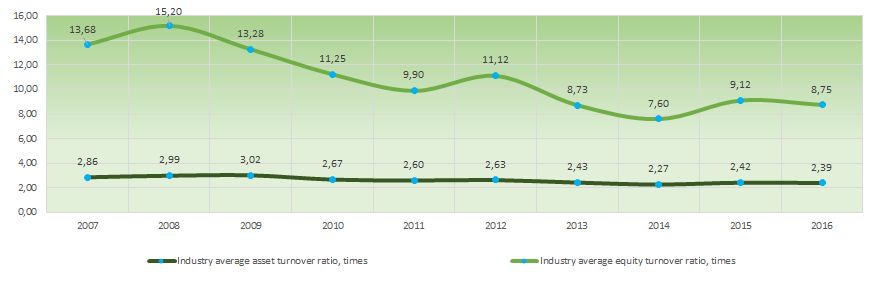 Picture 9. Change in the industry average values of the activity ratios of food retail companies for 2007 – 2016
 Structure of retail trade
More than a third of TOP-30000 companies specialize in retail trade mainly with food products, including beverages, and tobacco products in non-specialized stores (Picture 10).
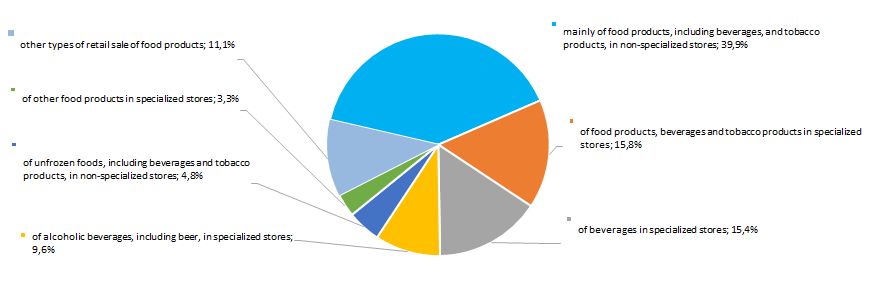 Picture 10. Distribution of TOP-30000 companies by types of retail trade, %
Dynamics of business activity
Over the 25-year period the number of registered companies from TOP-30000 list are unequally distributed by the year of foundation. The largest number of enterprises in the field of retail sale of food products was established in 2006 (Picture 11).
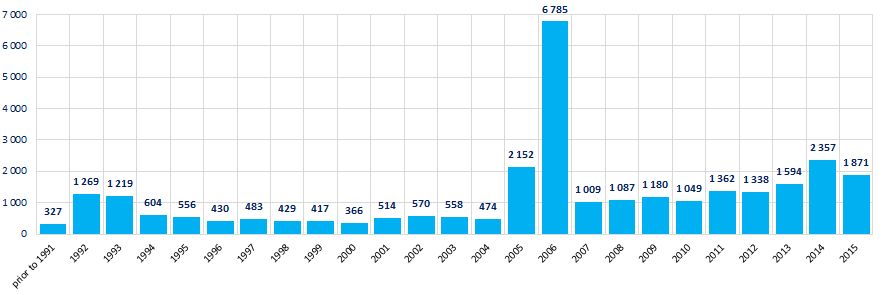 Picture 11. Distribution of TOP-30000 companies by years of their foundation
Business took the greatest interest to retail sale of food products during the period 2005 – 2009, when on average 2443 new companies were registered per annum. (Picture 12).
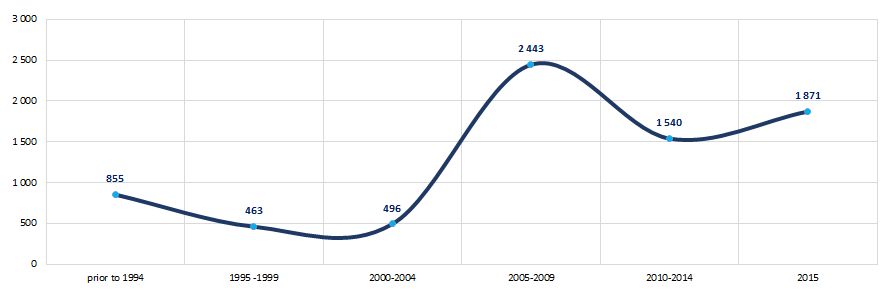 Picture 12. Average number of TOP-30000 companies registered within the year, by periods of their foundation
Main regions of activity
Companies engaged in retail sale of food products are relatively unequally distributed across the country. Their largest number is registered in regions with the largest population - Moscow, Moscow region and the Krasnodar territory (Picture 13). TOP-30000 companies are registered in 85 regions, i.e. in all subjects of the Russian Federation.
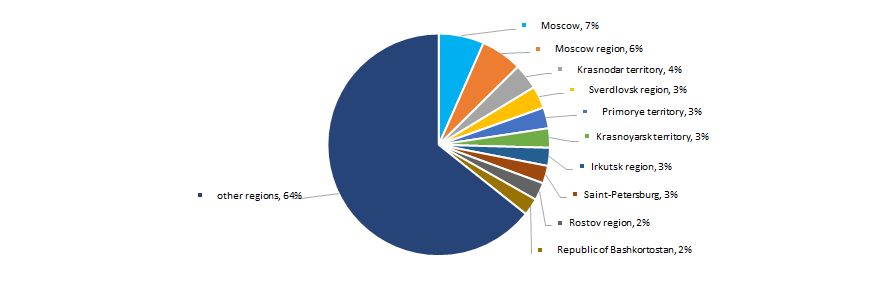 Picture 13. Distribution of TOP-30000 companies by regions of Russia
Solvency index Globas
The great majority of companies in the field of retail sale of food products from 30000 the largest enterprises got the highest or high Solvency index Globas(Picture 14).
As a whole, taking into account the main indices, financial indicators and ratios, this may point to relatively favorable trends in this field of activity.
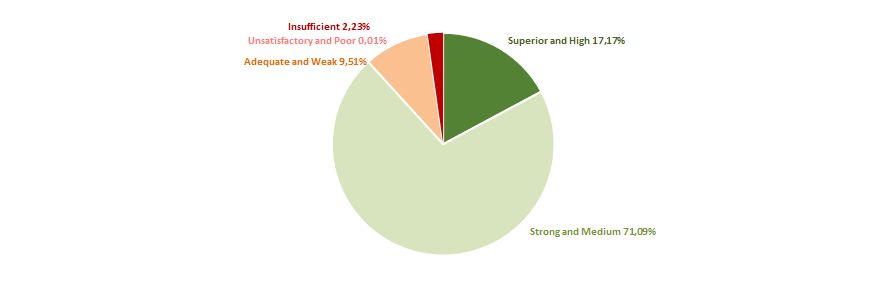 Picture 14. Distribution of TOP-30000 companies by Solvency index Globas