Ranking
The largest Russian manufacturers of buses and trolley buses by solvency ratio

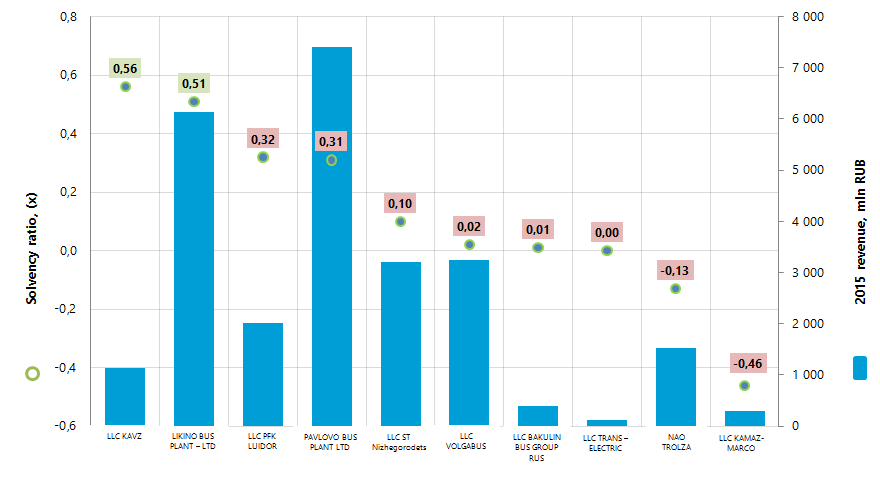
Information Agency Credinform has prepared the ranking of the largest Russian manufacturers of buses and trolley buses. The largest enterprises of the industry (TOP-10) in terms of annual revenue were selected according to the data from the Statistical Register for the latest available periods (2015 and 2014). Then the companies were ranged by solvency ratio (Table 1).

Solvency ratio (х) is calculated as a ratio of equity capital to total balance. The ratio shows the company’s dependence from external borrowings. The recommended value of the ratio is >0,5.

The ratio value less than minimum limit signifies about strong dependence from external sources of funds; such dependence may lead to liquidity crisis, unstable financial position in case of contraction in business conditions.

The calculation of practical values of financial indicators, which might be considered as normal for a certain industry, has been developed and implemented in the Information and Analytical system Globas-i® by the experts of Information Agency Credinform, taking into account the actual situation of the economy as a whole and the industries. The practical value of solvency ratio for bus and trolley bus manufacturers is from 0 to 0,58.

For the most full and fair opinion about the company’s financial position not only the compliance with standard values, but the whole set of financial indicators and ratios should be taken into account.

Table 1. Net profit, revenue, solvency ratio, solvency index Globas-i® of the largest Russian manufacturers of buses and trolley buses (TOP-10)
Name, INN, region2015 net profit, mln RUB2015 revenue, mln RUB2015/2014 revenue, +/- %Solvency ratio, (х)Solvency index Globas-i®
LLC KAVZ
INN 4501103580 Kurgan region
-18,77 1 128,68 -2,63 0,56 299
High
LIKINO BUS PLANT – LTD
INN 5034019312 Moscow region
-184,92 6 137,70 -29,12 0,51 291
High
LLC PFK LUIDOR
INN 5257065753 Nizhny Novgorod Region
43,05 2 017,47 -10,92 0,32 259
High
PAVLOVO BUS PLANT LTD
INN 5252015220 Nizhny Novgorod Region
141,30 7 399,84 -10,48 0,31 237
High
LLC ST Nizhegorodets
INN 5259062324 Nizhny Novgorod Region
38,17 3 204,39 -48,19 0,10 288
High
LLC VOLGABUS
INN 3435107555 Volgograd region
24,23 3 240,18 -5,31 0,02 292
High
LLC BAKULIN BUS GROUP RUS
INN 3435308935 Volgograd region
0,70 387,39 282,76 0,01 293
High
LLC TRANS – ELECTRIC
INN 3525297406 Vologda region
0,01 113,91 36,19 0,00 309
Satisfactory
NAO TROLZA
INN 6449972323 Saratov region
-349,46 1 530,41 33,92 -0,13 331
Satisfactory
LLC KAMAZ-MARCO
INN 1650238806 Republic of Tatarstan
-49,37 294,61 30,18 -0,46 344
Satisfactory
Total for TOP-10 group of companies -355,05 25 454,58 -19,22* 0,12*  
Total for TOP-24 group of companies ** -371,38 26 394,66 -16,81* 0,05*  

*) - Average value within group of companies
**) All companies, which provided 2015 financial statements to the Federal State Statistics Service

In 2015 the average value of solvency ratio within TOP-10 group of companies is higher than average value within TOP-24 group of companies with industry average value of 0,15. Meanwhile only two companies, which take first two places of the ranking, have the ratio within recommended and practical values.

Solvency ratio and revenue of the largest Russian manufacturers of buses and trolley buses (TOP-10)
Picture 1. Solvency ratio and revenue of the largest Russian manufacturers of buses and trolley buses (TOP-10)

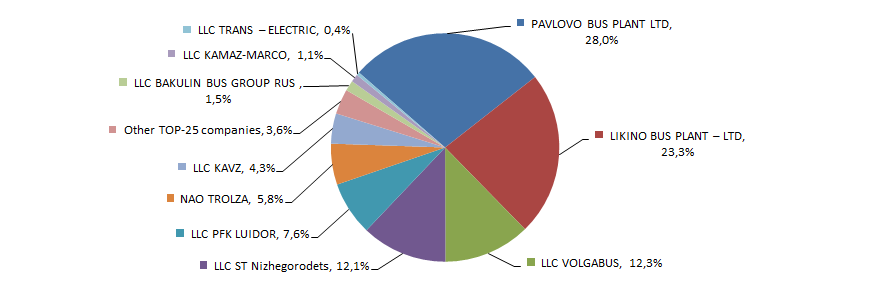
Total revenue of 10 largest companies amounted to 96% from TOP-24 total revenue. This fact testifies the high level of monopolization within industry. Thus, the share of the largest company by 2015 total revenue - PAVLOVO BUS PLANT LTD in TOP-24 total revenue amounted to 28% (Picture 2).

The shares of TOP-10 companies in TOP-24 total revenue for 2015, %
Picture 2. The shares of TOP-10 companies in TOP-24 total revenue for 2015, %

7 companies from TOP-10 list have high solvency index Globas-i®, this fact shows the ability of the companies to meet their obligations in time and fully.

3 out of 10 participants have satisfactory solvency index Globas-i®. Thus, LLC TRANS – ELECTRIC, NAO TROLZA and LLC KAMAZ-MARCO acted as a defendant in debt collection arbitration proceedings. Besides, NAO TROLZA as well as LLC KAMAZ-MARCO has unclosed enforcement orders and loss in balance sheet ratio structure. The forecast for companies’ index development is stable.

In 2015 among TOP-10 participants only LLC BAKULIN BUS GROUP RUS increased its net profit and revenue in comparison with previous period. Other companies (red color in Table 1) have loss or decrease in revenue or net profit.

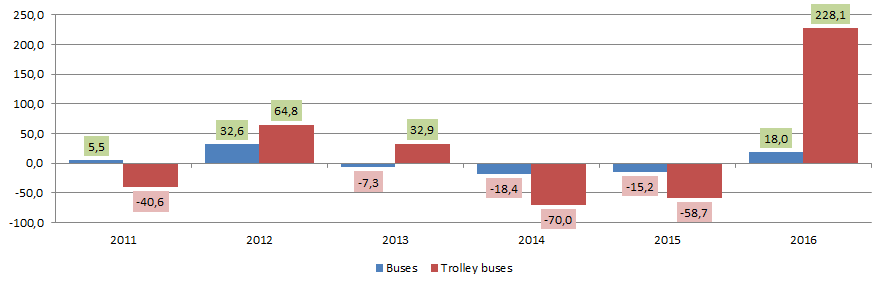
Within 2013-2015 the bus and trolley bus manufacturers’ ratios in natural terms were characterized by decrease in output volumes; this testifies the data from the Federal State Statistics Service (Table 2).

Table 2. Manufactures of buses and trolley buses, pieces
Types of products2010201120122013201420152016
Buses 40 784 43 051 57 077 52 926 43 208 36 655 43 241
Trolley buses 397 236 389 517 155 64 210

*) Red color in table 2 shows decline in production, green color shows the growth.

Increase in production, especially in production of trolleybuses, is marked in 2016; the growth is quite understandable, taking into account the volume of output (Picture 3).

Rate of growth / decline in production of buses and trolley buses from year to year, +/-, %
Picture 3. Rate of growth / decline in production of buses and trolley buses from year to year, +/-, %

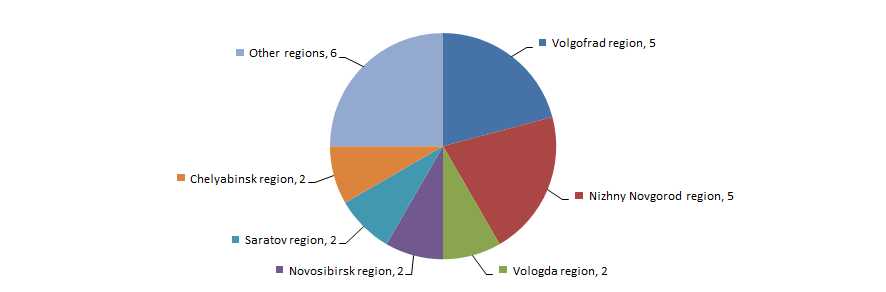
Manufacturers of buses and trolley buses are unequally distributed across the country and are basically concentrated in industrialized regions with developed infrastructure of automotive manufacture. This fact is confirmed by data from the Information and Analytical system Globas-i, according to which 24 largest companies of the industry in terms of 2015 revenue are registered in 12 Russian regions (Picture 4).

Рисунок 4. Distribution across the country of 24 largest Russian manufacturers of buses and trolley buses
Picture 4. Distribution across the country of 24 largest Russian manufacturers of buses and trolley buses
Herald
Gastronomical map of Russia

In the run up to the spring and the 8th of March, it will be touched upon basic food consumption in the Russian regions instead of traditional topic about demography of enterprises and main trends in the Russian economy. The share of food products essential for festive table in total caloric ration of households will also be examined.

It is not a stretch that our food and its components are key to health and impact the family, company, economy and the country’s well-being. The state’s ability to satisfy the demand on basic food first of all by means of domestic production determines the level of food security.

Russia is a country where bread and bread products take 35,8% of total food energy ration and traditionally lead in caloric ration (Caloric ration is caloric value (kcal) of products consumed, expressed in % to total sum of kcal consumed for the period. See Picture 1). Bread is a popular product with high calorie value and comparably low cost.

The share of meat and meat products is only 17,2%, and 12,2% falls for milk and dairy products.

Unfortunately fish and seafood, being wholesome food, have just 1,7% in the Russians’ ration. Fish, especially saltwater, is mostly imported, that is why its price is high and the product is difficult to buy. Despite Russia has developed river system and is washed by many seas, there is no common culture of fish consumption as in Japan or Norway. Fish is rarely eaten in national republics of Caucasus because of local cuisine traditions. In central Russia imported fish is very expensive, at the same time local is seasonally consumed and has low nutrition value.

Share of basic food in total caloric ration of households in Russia.Picture 1. Share of basic food in total caloric ration of households in Russia.

Analysis of basic food consumption is based upon data of the Federal State Statistics Service (Rosstat). It should be noted that data doesn’t include domestic subsidiary crop production and cattle breeding of private household and farms, products of which are not supplied to retail chains and markets. As a result, consumption of fruits and vegetables in south region is statistically low than in some northern ones, and territories where cattle breeding is traditional are among the last by meat consumption.

According to Rosstat, bread and bread products are mostly consumed in the Republic of Ingushetia – 177 kg/annum per 1 consumer; this figure is amounted to 95 kg for the country in general. The largest share of bread in total caloric value is recorded in the Republic of Tyva – 52,1%. Bread there is a half of all products bought in retailers that can be explained by modest personal income, high cost of transportation to this distant Siberian region, as well as tradition to satisfy meat and dairy demand by means of private farm household.

Moscow and Saint-Petersburg citizens progressively refuse from bread for other products – vegetables, fruits and meat.

Meat consumption for the country in general is 95 kg/annum per 1 consumer. This figure is 92 kg in Moscow and 81 kg in Saint-Petersburg.

The Republic of Kabardino-Balkaria leads in consumption of milk and dairy products within the country – 347 in liter equivalent: goat milk and local cheese are favorite delicacy. Saint-Petersburg leads in maximum share of dairy products in total caloric ration – 14%.

The Republic of Marii El consumes the most of sugar and sugary confectioneries per 1 consumer – 42 kg, and the least accounts for the Republic of Kalmykia – 22 kg. This figure for the country in general is 31 kg. Saint-Petersburg in regional rating stands 64th with 29 kg and Moscow is on the last 85 rank with 21 kg. Maximum consumption of vegetable oil and other plant origin fats is recorded in the Republic of Kabardino-Balkaria – 15 kg/annum, and the least in Moscow and Saint-Petersburg – 8 kg/annum.

Belgorod region and Sevastopol lead in fruits and berries – 91 and 90 kg/annum, when consumption within the country is 71 kg at average.

Amur region leads in demand on potato: the region is on the top not only by total consumption – 97 kg/annum, but also by its share of 6% in the total caloric ration. On the contrary, potato is not among Moscow and the Republic of Tyva’s favorites – 41 and 39 kg/annum per 1 consumer respectively.

Speaking about vegetables and cucurbits crops, Astrakhan region leads in this position – 135 kg/annum. It should come as no surprise, because the climate of this region is favorable for growing melons and various vegetables. The least vegetables consumption is recorded for the Republic of Tyva – 41 kg/annum per 1 consumer. This figure for the country in general is 100 kg, in Saint-Petersburg – 114 kg and 110 kg in Moscow.

Expectedly, fish and fish products are more common in main regions of its harvesting and farming: Primorye territory, Magadan and Astrakhan region, where fish consumption is maximum – 34-35 kg/annum. The smallest figure is for the Republic of Tyva – 7 kg.

Most of eggs are consumed in Belgorod region – 266 pcs and fewest accounts for the Republic of Kalmykia – 120 pcs. For the country in general this figure is 218 pcs per 1 consumer.

The presented statistics speaks about differences among Russian regions not only by climate, fiscal capacity level, demographic, social and economic development, but also by volume of basic food consumption, their share in total caloric ration. Nowadays bread and bread products prevail on the table of common inhabitant; fish, fruits and berries are not so spread. As is recommended by the Ministry of Health, the rational norm for meat and meat products should be 73 kg/annum per capita, fish and fish products – 22 kg, milk and dairy products – 325 kg, vegetables and cucurbits crops (excluding potato) – 140 kg, fruits and vegetables – from 100 kg, bread and bread products – 96 kg, potato – 90 kg, sugar – 24 kg, eggs – 260 pcs, vegetable oil and other fats – 12 kg. Therefore, many regions are far from norm.

Low income, lack of own resource base especially for fruits and vegetables growing in protected ground, underdevelopment of spawning fisheries are deterrent for widening of ration and consumption volume. All these make Russia dependent on expensive import of certain commodity groups that is especially noticeable at rouble devaluation. The most important are reduction of the number of commercial agents and creation of logistic centers supported by the state and engaged in transportation of agricultural products among regions, as well as access for local producers to retail chains.

However there are positive changes in domestic agriculture in the recent years: ban on supplies of wide list of agricultural products from the EU countries, being a significant part in our market, resulted in almost complete substitution of imported dairy products and poultry for domestic ones. The share of foreign cattle meat has also reduced. Increase in real income of the population occurred at the beginning of the current year should have positive impact on growth in healthy food consumption day by day and of course at festive table.

In conclusion of our Newsletter, Information agency Credinform congratulates beautiful ladies with forthcoming the 8th of March and wishes health, well-being and sunny cheers to everybody!

Table 1. Consumption of basic food per 1 consumer of private household a year, kg. (Dark green shading stands for maximum consumption, dark red – for minimal. Data for 2015.)
Consumption of basic food per 1 consumer of private household a year, kg.


Table 2. Share of basic food in total caloric ration, % (Dark green shading stands for maximum consumption, dark red – for minimal. Data for 2015.)
Share of basic food in total caloric ration, %.