Information agency Credinform has prepared a ranking of the largest Russian companies engaged in wholesale trade of flour and noodle products. The largest enterprises (TOP-10) in terms of annual revenue were selected according to the data from the Statistical Register for the available periods (2016-2018). Then the companies were ranged by profitability of sales (Table 1). The analysis was based on the data from the Information and Analytical system Globas.
Profitability of sales (%) is the share of operating profit in the sales volume of the company. The ratio characterizes the efficiency of the industrial and commercial activity and shows the company’s funds, which remained after covering the cost of production, interest and tax payments.
The rage of ratio’s values within companies of the same industry is defined by the differences in competitive strategies and product lines.
For the most full and fair opinion about the company’s financial position the whole set of financial indicators and ratios should be taken into account.
Name, INN, region | Revenue, million RUB | Net profit (loss), million RUB | Profitability of sales, % | Solvency index Globas | |||
2017 | 2018 | 2017 | 2018 | 2017 | 2018 | ||
1 | 2 | 3 | 4 | 5 | 6 | 7 | 8 |
LLC DOSHIRAK RUS INN 7729663418 Moscow |
![]() |
![]() |
![]() |
![]() |
![]() |
![]() |
173 Superior |
LLC Mir Bakalei INN 7724189748 Moscow |
![]() |
![]() |
![]() |
![]() |
![]() |
![]() |
195 High |
INFOLINK INCORPORATED INN 7724026535 Moscow |
![]() |
![]() |
![]() |
![]() |
![]() |
![]() |
180 High |
JSC TRADE HOUSE BORNEO INN 5433113660 Novosibirsk region |
![]() |
![]() |
![]() |
![]() |
![]() |
![]() |
203 Strong |
LLC AGROINDUSTRIYA INN 7106060700 Tula region |
![]() |
![]() |
![]() |
![]() |
![]() |
![]() |
240 Strong |
LLC KRUPTORG GARANT INN 2462215861 Krasnoyarsk region, case on declaring the company bankrupt (insolvent) is proceeding, bankruptcy proceedings since 31.10.2019 |
![]() |
![]() |
![]() |
![]() |
![]() |
![]() |
550 Insufficient |
LLC UPRAVLENIE OPTOVOI TORGOVLI INN 2320049658 Republic of Tatarstan |
![]() |
![]() |
![]() |
![]() |
![]() |
![]() |
233 Strong |
LLC TRADE COMPANY ALFA INN 3801113450 Irkutsk region |
![]() |
![]() |
![]() |
![]() |
![]() |
![]() |
304 Adequate |
LLC PANGEYA INN 0273028534 Republic of Bashkortostan |
![]() |
![]() |
![]() |
![]() |
![]() |
![]() |
244 Strong |
LLC TRADE COMPANY Rus-MATUSHKA INN 1835081820 Udmurtia |
![]() |
![]() |
![]() |
![]() |
![]() |
![]() |
295 Medium |
Average value for TOP-10 companies | ![]() |
![]() |
![]() |
![]() |
![]() |
![]() |
|
Average industry value | ![]() |
![]() |
![]() |
![]() |
![]() |
![]() |
growth of indicator in comparison with prior period,
decline of indicator in comparison with prior period
In 2018, the average value of profitability of sales for TOP-10 companies is lower than average industry value: eight companies improved the results.
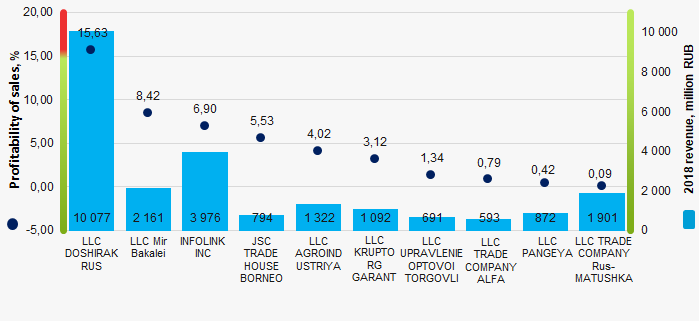
Within 10 years, the average industry indicators of profitability of sales showed the growing tendency. (Picture 2).
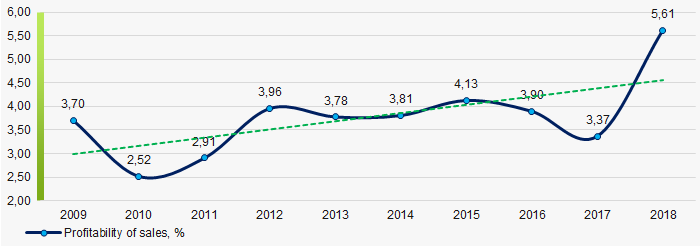
In order to reduce the interregional differences in the level and quality of life of the population, to accelerate economic growth and technological development and to ensure the national security of the country, in February 2019 the Russian Government approved the Strategy of Spatial Development of the Russian Federation until 2025. It consists of 12 macro-regions; one of them is North-Western Region, which includes St. Petersburg, Leningrad, Novgorod and Pskov regions.
Information agency Credinform has prepared a review of activity trends of the largest companies of the real economy sector in the North-Western Economic Region of Russia.
The largest companies (ТОP-1000) in terms of annual revenue were selected according to the data from the Statistical Register for the latest available periods (2013 - 2018). The analysis was based on data of the Information and Analytical system Globas.
Net assets is a ratio reflecting the real value of company's property. It is calculated annually as the difference between assets on the enterprise balance and its debt obligations. The ratio is considered negative (insufficiency of property), if company’s debt exceeds the value of its property.
The largest company in terms of net assets is LLC GAZPROM MEZHREGIONGAZ, INN 5003021311, St. Petersburg. In 2018 net assets of the company amounted to more than 793 billion RUB.
The smallest size of net assets in TOP-1000 had CJSC BALTIC PEARL, INN 7801377058, St. Petersburg. The lack of property of the company in 2018 was expressed in negative terms -19 billion RUB.
For the last five years, the average values of TOP-1000 net assets showed the growing tendency (Picture 1).
For the last five years, the share of ТОP-1000 enterprises with lack of property is decreasing (Picture 2).
Sales revenue
In 2018, the total revenue of 10 largest companies amounted to 45% from ТОP-1000 total revenue (Picture 3). This fact testifies the high level of capital concentration.
In general, the growing trend in sales revenue is observed (Picture 4).
Profit and loss
The largest company in terms of net profit is JSC Gazprom Neft, INN 5504036333, St. Petersburg. In 2018 the company’s profit amounted to more than 90 billion RUB.
For the last five years, the average profit values of TOP-1000 show the growing tendency (Picture 5).
Over a five-year period, the average net profit values of ТОP-1000 show the growing tendency, along with this the average net loss is decreasing (Picture 6).
Main financial ratios
For the last five years, the average values of the current liquidity ratio were higher than the recommended values - from 1,0 to 2,0, with growing trend (Picture 7).
The current liquidity ratio (ratio of total working capital to short-term liabilities) shows the sufficiency of company’s assets to meet short-term obligations.
Within five years, the high level of the average values of ROI ratio with downward trend is observed (Picture 8).
The ROI ratio is calculated as a ratio of net profit to sum of stockholder equity and long-term liabilities and shows the return from equity involved in commercial activities and long-term borrowed funds.
Assets turnover ratio is the ratio of sales revenue and company’s average total assets for a period. It characterizes the effectiveness of using of all available resources, regardless the source of their attraction. The ratio shows how many times per year the full cycle of production and circulation is performed, generating the corresponding effect in the form of profit.
For the last five years, this business activity ratio demonstrated the downward trend (Picture 9).
Small businesses
10% of ТОP-1000 companies are registered in the Unified register of small and medium-sized enterprises of the Russian Federal Tax Service. Herein, their share in TOP-1000 total revenue is about 1%, which is significantly lower than the national average value in 2018 – 2019 (Picture 10).
Main regions of activity
ТОP-1000 companies are unequally located across the country and registered in 4 regions of Russia. 87% of the largest enterprises in terms of revenue are located in St. Petersburg (Picture 11).
Financial position score
An assessment of the financial position of TOP-1000 companies shows that the largest part have above average financial position (Picture 12).
Solvency index Globas
Most of TOP-1000 companies got superior/high or strong/medium Solvency index Globas, this fact shows the ability of the companies to meet their obligations in time and fully (Picture 13).
Industrial production index
According to the Federal Service of State Statistics, there is a growing trend in the industrial production index in the North-Western Economic Region of Russia during 12 months of 2019 – 2020 (Picture 14). Herewith the average index from month to month amounted to 99,5%.
According to the same data, the share of enterprises of the North-Western Economic Region of Russia in the amount of revenue from the sale of goods, works, services made 9,550% countrywide in 2019, that is lower than in 2018 (9,787%).
Conclusion
A complex assessment of activity of the largest companies of real economy sector in the North-Western Economic Region of Russia, taking into account the main indexes, financial ratios and indicators, demonstrates the presence of positive trends (Table 1).
Trends and assessment factors | Relative share, % |
Growth/drawdown rate of average net assets value | ![]() |
Increase / decrease in the share of enterprises with negative net assets | ![]() |
The level of competition / monopolization | ![]() |
Growth/drawdown rate of average revenue | ![]() |
Growth/drawdown rate of average net profit (loss) | ![]() |
Increase / decrease in average net profit of companies | ![]() |
Increase / decrease in average net loss of companies | ![]() |
Increase / decrease in average values of current liquidity ratio | ![]() |
Increase / decrease in average values of ROI ratio | ![]() |
Increase / decrease in average values of assets turnover ratio, times | ![]() |
Share of small and medium-sized businesses by revenue more than 22% | ![]() |
Regional concentration | ![]() |
Financial position (the largest share) | ![]() |
Solvency index Globas (the largest share) | ![]() |
Industrial production index | ![]() |
Dynamics of the share of enterprises in the total amount of revenue countrywide | ![]() |
Average value of factors | ![]() |
favorable trend (factor),
unfavorable trend (factor).