
Order a report
Custom-made industry research, company ratings, competitor analysis


TOP pipeline transport companies
Pipeline transport is one of the cheapest ways of oil and gas transportation to the places of its consumption. It became more important now when Nord Stream 2 pipeline construction was completed. However, analysis of the activity trends of the TOP 100 Russian companies in the industry from 2011 to 2020 shows some negative trends.
The most important of them are high level of monopolization, increase in shares of the companies with insufficient property, decline in profit and growth in loss, decline in financial ratios values. Among positive trends there is growth in the size of net assets and increase in the size of revenue.
For this analysis information agency Credinform selected the largest companies performing gases, fluids, water, cement grout and also other kinds of freights transportation via pipelines (TOP 100) in terms of annual revenue according to the data from the Statistical Register and the Federal Tax Service for the latest available periods (2011-2020). The analysis was based on the data of the Information and Analytical system Globas.
Net assets are total assets less total liabilities. This indicator reflects the real value of the property of an enterprise. When the company’s debt exceeds the value of its property, the indicator is considered negative (insufficiency of property).
The largest company in term of net assets is LLC TRANSNEFT-VOSTOK, INN 3801079671, Irkutsk Region, oil transportation via pipelines. In 2020 net assets of the company exceeded 453 billion RUB.
The lowest net assets value among TOP 100 belonged to GAZPROM GAZORASPREDELENIE DAGESTAN, INN 0561049072, Republic of Dagestan, gas transportation via pipeline. Insufficient property figured out negative value -6 billion RUB.
For the ten-year period the average net assets values and rates of its growth tend to increase. (Picture 1).
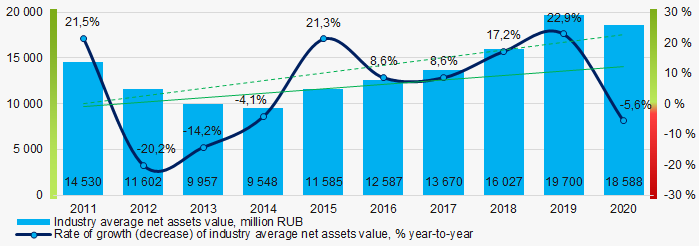 Picture 1. Change in industry average net assets value in 2011– 2020
Shares of the companies with insufficient property had a negative trend to increase. (Picture 2).
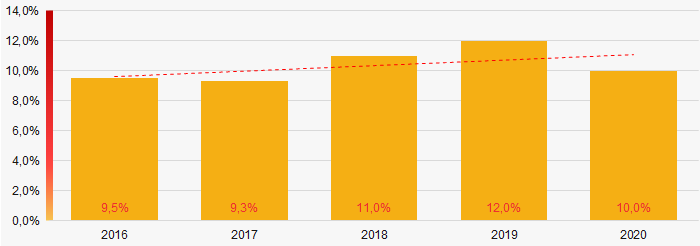 Picture 2. Shares of TOP 100 companies with negative net assets value in 2016-2020
Sales revenue
In 2020, the revenue volume of the ten largest companies was about 71% of total TOP 100 revenue (Picture 3). This indicates a high level of monopolization in the industry.
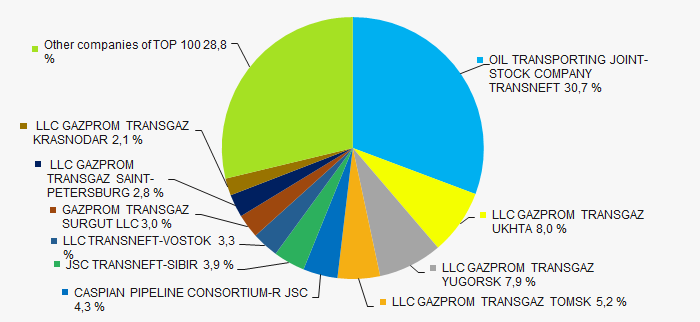 Picture 3. The share of TOP 10 companies in total 2020 revenue of TOP 100
For ten years industry average revenue values and rates of its growth increase with every year. (Picture 4).
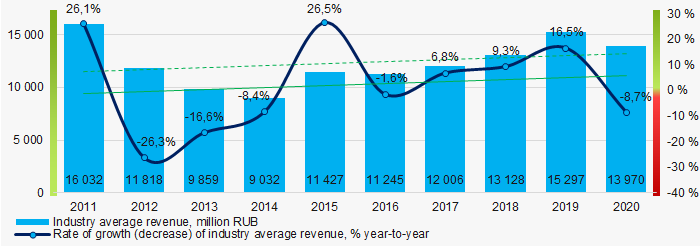 Picture 4. Change in industry average net profit in 2016 – 2020
Profit and loss
In 2020, the largest organization in term of profit was OIL TRANSPORTING JOINT-STOCK COMPANY TRANSNEFT, INN 7706061801, Moscow, oil and oil products transportation via pipeline. The company’s profit exceeded 65 billion RUB.
For the ten-year period there is a trend to decrease in the industry average net profit with increasing growth rate (Picture 5).
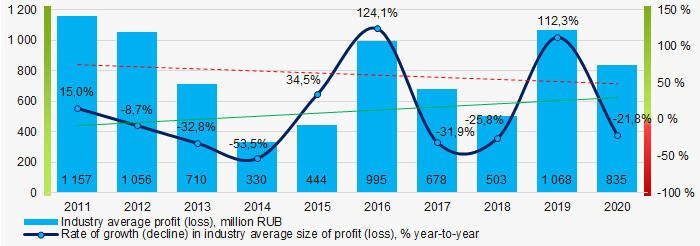 Picture 5. Change in industry average profit (loss) in 2011 - 2020
For the five-year period average net profit of TOP 100 have a decreasing trend with increasing net loss (Picture 6).
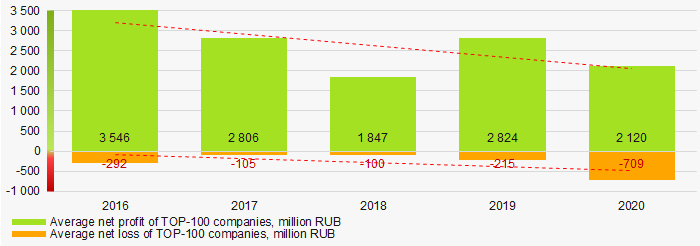 Picture 6. Change in average net profit and average net loss of TOP 100 companies in 2016 - 2020
Key financial ratios
For the ten-year period industry average values of current liquidity ratio were mostly in the range of the recommended one - from 1,0 to 2,0 with a trend to decrease. (Picture 7).
Current liquidity ratio (current assets to short-term liabilities) shows the sufficiency of company’s assets to repay on short-term liabilities.
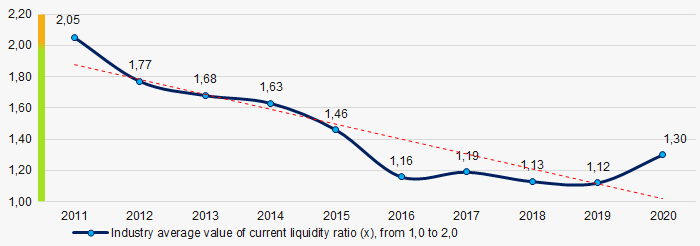 Picture 7. Change in industry average value of current liquidity ratio in 2011 - 2020
For the ten-year period industry average values of ROI ratio were decreasing. (Picture 8).
ROI ratio is calculated as net profit to sum of shareholders equity and long-term liabilities, and shows the return of equity involved in commercial activities and long-term borrowed funds.
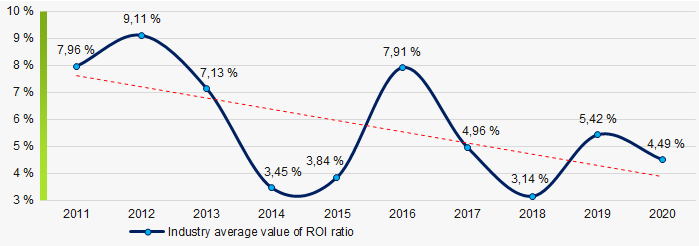 Picture 8. Change in industry average value of ROI ratio in 2011 - 2020
Assets turnover ratio is the ratio of sales revenue and company’s average total assets for a period. It characterizes the effectiveness of using of all available resources, regardless the source of their attraction. The ratio shows how many times per year the full cycle of production and circulation is performed, generating the corresponding effect in the form of profit.
For the ten-year period industry average values of assets turnover ratio had a trend to decrease. (Picture 9).
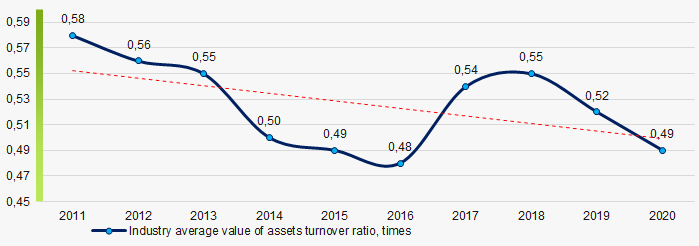 Picture 9. Change in industry average value of assets turnover ratio in 2011 – 2020
Small business
49% of the TOP 100 companies are registered in the Register of small and medium-sized enterprises of the Federal Tax Service of the Russian Federation. Moreover their share in total revenue of the TOP 100 in 2020 is only 0,2% that is way below the average values over the country in 2018 - 2019. (Рисунок 10).
 Picture 10. Shares of small and medium-sized enterprises in TOP 100
Main regions of activity
Companies of TOP-100 are registered in 39 regions of Russia, and unequally located across the country due to the specifics of their activity. Almost 84% of total revenue of TOP 100 companies in 2020 are located in ten regions (Picture 11).
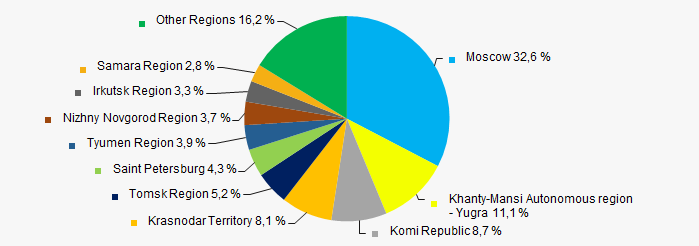 Picture 11. Distribution of TOP-100 revenue by regions of Russia
Financial position score
Assessment of the financial position of TOP-1000 companies shows that the majority of them have average financial position (Picture 12).
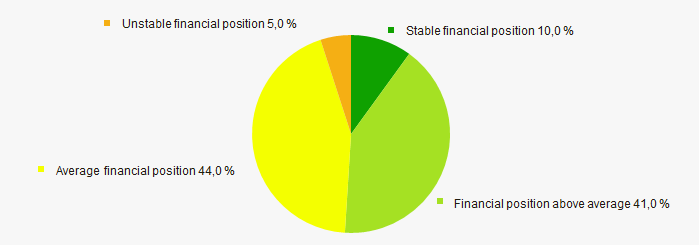 Picture 12. Distribution of TOP 1000 companies by financial position score
Solvency index Globas
Most of TOP 1000 companies got Superior / High indexes Globas. This fact shows their ability to meet their obligations on time and in full (Picture 13).
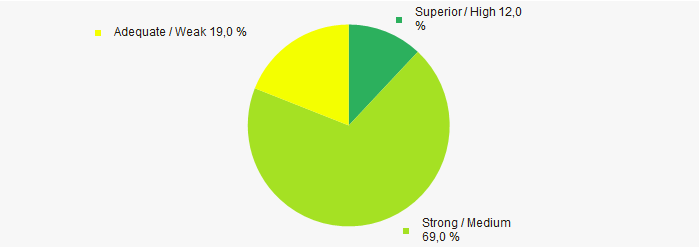 Picture 13. Distribution of TOP 100 companies by Solvency index Globas
Conclusion
Complex assessment of activity of the largest pipeline transport companies demonstrates the prevalence of negative trends in 2011 - 2020 (Table 1).
| Trends and evaluation factors | Relative share of factors, % |
| Dynamics of the average net assets value | |
| Rate of growth (decline) in the average size of net assets | |
| Increase / decrease in the share of enterprises with negative values of net assets | |
| Level of competition / monopolization | |
| Dynamics of the average revenue | |
| Rate of growth (decrease) in the average size of revenue | |
| Dynamics of the average profit (loss) | |
| Rate of growth (decrease) in the average profit (loss) | |
| Growth / decline in average values of companies’ net profit | |
| Growth / decline in average values of companies’ net loss | |
| Increase / decrease in average values of total liquidity ratio | |
| Increase / decrease in average values of return on investment ratio | |
| Increase / decrease in average values of asset turnover ratio, times | |
| Share of small and medium-sized businesses in terms of revenue being more than 20% | |
| Regional concentration | |
| Financial position (the largest share) | |
| Solvency index Globas (the largest share) | |
| Average value of relative share of factors | |
![]() positive trend (factor),
positive trend (factor), ![]() negative trend (factor)
negative trend (factor)