Order a report
Custom-made industry research, company ratings, competitor analysis


The largest Russian manufacturers of textile products by current liquidity ratio
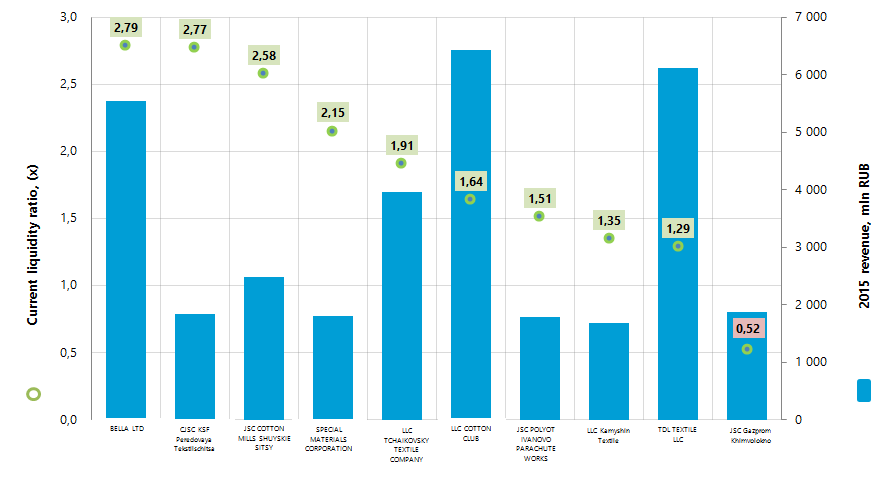
Information Agency Credinform has prepared the ranking of the largest Russian manufacturers of textile products. The largest enterprises of the industry (TOP-10) in terms of annual revenue were selected according to the data from the Statistical Register for the latest available periods (2015 and 2014). Then the companies were ranged by current liquidity ratio (Table 1).
Current liquidity ratio (х) is a ratio of total working capital to short-term liabilities. The ratio shows the sufficiency of company’s assets to meet short-term obligations.
The recommended value is from 1,0 to 2,0. The ratio value less than 1 indicates about the excess of short-term liabilities over current working capital.
The calculation of practical values of financial indicators, which might be considered as normal for a certain industry, has been developed and implemented in the Information and Analytical system Globas-i® by the experts of Information Agency Credinform, taking into account the actual situation of the economy as a whole and the industries. The practical value of current liquidity ratio for textile products manufacturers is from 0,99 to 2,95.
For the most full and fair opinion about company’s financial position not only the compliance with standard values, but the whole set of financial indicators and ratios should be taken into account.
| Name, INN, region | 2015 net profit, mln RUB | 2015 turnover, mln RUB | 2015/2014 revenue, +/- % | Current liquidity ratio, (х) | Solvency index Globas-i® |
|---|---|---|---|---|---|
| BELLA LTD INN 5011021499 Moscow region |
311,3 | 5 537,1 | 46 | 2,79 | 200 High |
| CJSC KSF Peredovaya Tekstilschitsa INN 5018035099 Moscow region |
37,9 | 1 827,6 | 7 | 2,77 | 180 The highest |
| JSC COTTON MILLS SHUYSKIE SITSY INN 3706008060 Ivanovo region |
1,1 | 2 472,3 | 5 | 2,58 | 241 High |
| SPECIAL MATERIALS CORPORATION INN 7806125671 Saint-Petersburg |
97,9 | 1 807,1 | 49 | 2,15 | 175 The highest |
| LLC TCHAIKOVSKY TEXTILE COMPANY INN 5920015180 Perm region |
62,3 | 3 953,1 | 24 | 1,91 | 209 High |
| LLC COTTON CLUB INN 7720676268 Moscow region |
77,3 | 6 423,2 | 25 | 1,64 | 269 High |
| JSC POLYOT IVANOVO PARACHUTE WORKS INN 3731001750 Ivanovo region |
415,9 | 1 776,6 | 42 | 1,51 | 181 The highest |
| LLC Kamyshin Textile INN 3436017030 Volgograd region |
1,1 | 1 672,3 | 54 | 1,35 | 292 High |
| TDL TEXTILE LLC INN 3730010504 Ivanovo region |
497,0 | 6 109,5 | 22 | 1,29 | 229 High |
| JSC Gazprom Khimvolokno INN 3435991384 Volgograd region |
-377,0 | 1 878,7 | 170 | 0,52 | 315 Satisfactory |
| Total for TOP-10 group of companies | 1 124,8 | 33 457,7 | *49 | *1,85 | |
| Total for TOP-100 group of companies | 2 527,1 | 87 596,0 | *43 | *2,14 | |
| **1,14 |
*) - average value within group of companies
**) – average value within industry
In 2015 the average value of current liquidity ratio within TOP-10 group of companies is lower than average value within TOP-100 group of companies and higher than industry average value. Meanwhile only JSC Gazprom Khimvolokno from TOP-10 list has ratio within recommended and practical values.
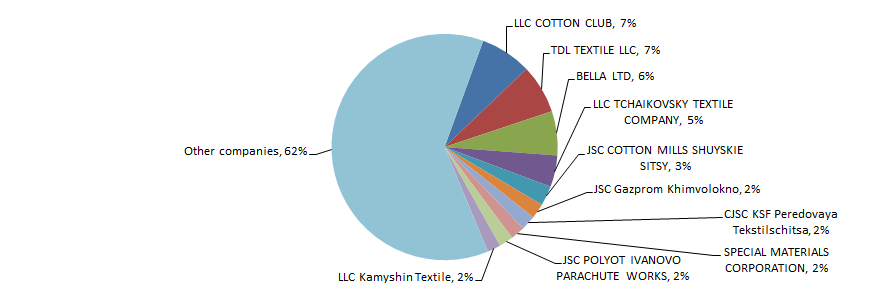
Total revenue of 10 largest companies amounted to 38% from TOP-100 total revenue. This fact testifies the high level of competition within industry. The shares of the largest companies by 2015 total revenue - LLC COTTON CLUB and TDL TEXTILE LLC in TOP-100 total revenue amounted to 7% (Picture 2).
9 companies from TOP-10 list have the highest or high solvency index Globas-i®, this fact shows the ability of the companies to meet their obligations in time and fully.
JSC Gazprom Khimvolokno has satisfactory solvency index Globas-i® due to participation as a defendant in debt collection arbitration proceedings and loss in balance sheet ratio structure. The forecast for companies’ index development is stable.
In 2015 all TOP-10 participants increased its net profit. However 3 companies have decrease in revenue in comparison with previous period and JSC Gazprom Khimvolokno has loss (red color in Table 1).
In 2014 the TOP-100 list included 20 loss-making companies and in 2015 the number decreased to 13.
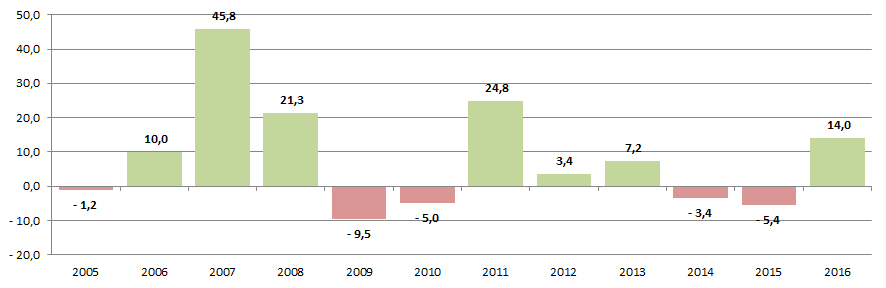
In general within 2004-2016 the ratios of textile products manufacturers in money terms were unstable; this testifies the data from the Federal State Statistics Service (Table 2).
| 2004 | 2005 | 2006 | 2007 | 2008 | 2009 | 2010 | 2011 | 2012 | 2013 | 2014 | 2015 | 2016 | |
|---|---|---|---|---|---|---|---|---|---|---|---|---|---|
| Manufacture of other textile products | |||||||||||||
| 794 288 | 928 828 | 987 235 | 1 409 677 | 1 691 709 | 1 652 979 | 1 595 180 | 1 889 129 | 2 389 617 | 2 635 031 | 2 665 239 | 2 752 813 | 3 071 993 | |
| Manufacture of cotton fabrics | |||||||||||||
| 998 998 | 1 022 809 | 1 267 476 | 2 172 420 | 2 885 766 | 2 532 102 | 2 449 511 | 2 483 947 | 1 962 233 | 1 978 127 | 1 971 150 | 1 884 910 | 1 994 453 | |
| Manufacture of man-made fibers | |||||||||||||
| 395 722 | 348 086 | 387 625 | 538 372 | 1 076 739 | 818 639 | 765 609 | 1 075 593 | 1 154 562 | 1 026 716 | 1 032 604 | 777 826 | 1 137 957 | |
| Spinning of textile fibers | |||||||||||||
| 439 440 | 300 445 | 259 108 | 501 201 | 520 613 | 562 398 | 626 354 | 809 789 | 925 055 | 1 045 964 | 817 491 | 848 695 | 1 103 144 | |
| Manufacture of other textile products, not included in other groups | |||||||||||||
| 432 355 | 491 876 | 498 975 | 585 357 | 717 285 | 594 733 | 564 537 | 749 854 | 853 006 | 875 885 | 926 843 | 988 717 | 1 094 847 | |
| Manufacture of silk fabrics | |||||||||||||
| 264 668 | 321 603 | 328 645 | 440 679 | 640 331 | 546 287 | 670 659 | 785 994 | 1 020 689 | 1 128 605 | 1 165 621 | 798 866 | 1 015 079 | |
| Manufacture of textile products for various purposes, not included in other groups | |||||||||||||
| 244 312 | 287 714 | 277 026 | 332 140 | 461 914 | 349 561 | 339 794 | 441 395 | 418 074 | 583 796 | 624 136 | 703 648 | 827 238 | |
| Manufacture of other textile products | |||||||||||||
| 456 962 | 479 771 | 539 613 | 813 344 | 775 102 | 813 578 | 674 589 | 1 124 644 | 973 554 | 1 120 988 | 922 432 | 792 785 | 764 880 | |
| Manufacture of ropes, fiber ropes, twine and nets | |||||||||||||
| 112 954 | 110 761 | 131 112 | 179 836 | 225 104 | 142 493 | 131 763 | 205 064 | 241 417 | 215 215 | 208 728 | 188 928 | 178 284 | |
| Manufacture of wool fabrics using worsted spinning system | |||||||||||||
| 37 068 | 131 863 | 165 050 | 155 912 | 182 093 | 218 885 | 144 433 | 184 487 | 126 661 | 239 413 | 247 164 | 313 730 | 163 634 | |
| Manufacture of sewing threads | |||||||||||||
| 128 569 | 78 479 | 83 311 | 125 079 | 128 912 | 98 058 | 101 056 | 160 275 | 180 505 | 149 643 | 116 970 | 153 821 | 152 409 | |
| Spinning of flax fibers | |||||||||||||
| 35 186 | 29 822 | 12 991 | 12 736 | 19 808 | 26 042 | 31 430 | 27 904 | 66 431 | 90 827 | 86 651 | 117 475 | 145 468 | |
| Manufacture of textile fabrics | |||||||||||||
| 24 860 | 19 878 | 16 116 | 19 508 | 17 297 | 17 061 | 35 776 | 41 159 | 25 852 | 32 103 | 88 262 | 66 690 | 124 562 | |
| Manufacture of wool fabrics using fiber carded spinning | |||||||||||||
| 582 883 | 359 236 | 467 533 | 613 057 | 294 286 | 336 006 | 103 493 | 250 937 | 294 171 | 275 196 | 230 339 | 121 947 | 121 086 | |
| Spinning of cotton fibers | |||||||||||||
| 85 662 | 60 930 | 47 928 | 76 417 | 37 437 | 51 069 | 85 646 | 148 931 | 102 320 | 110 665 | 12 377 | 946 | 85 072 | |
| Total | |||||||||||||
| 5 033 927 | 4 972 101 | 5 469 744 | 7 975 735 | 9 674 396 | 8 759 891 | 8 319 830 | 10 379 102 | 10 734 147 | 11 508 174 | 11 116 007 | 10 511 797 | 11 980 106 | |
*) Red color in table 2 shows decline in production, green color shows the growth.
In general, the maximum industrial growth was observed in 2007 and the maximum recession – in 2009. Increase in production is marked in 2016 (Picture 3).
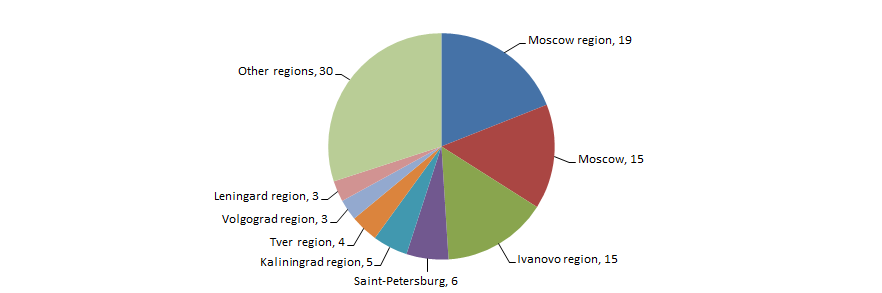
Manufacturers of textiles are unequally distributed across the country and are basically concentrated in industrialized regions with developed production structure, which is especially typical for Ivanovo and Moscow regions. This fact is confirmed by data from the Information and Analytical system Globas-i, according to which 100 largest companies of the industry in terms of 2015 revenue are registered in 30 Russian regions (Picture 4).