
Order a report
Custom-made industry research, company ratings, competitor analysis


Profit level of microfinance companies
Information agency Credinform has prepared a ranking of the largest Russian microfinance companies. The largest enterprises (TOP-10) in terms of annual revenue were selected according to the data from the Statistical Register for the available periods (2016-2018). Then the companies were ranged by net profit ratio (Table 1). The analysis was based on the data from the Information and Analytical system Globas.
Net profit ratio (%) is calculated as a ratio of net profit (loss) to sales revenue. The ratio reflects the company’s level of sales profit.
The ratio doesn’t have the standard value. It is recommended to compare the companies within the industry or the dynamics of a ratio for a certain company. The negative value of the ratio indicates about net loss. The higher is the ratio value, the better the company operates.
For the most full and fair opinion about the company’s financial position the whole set of financial indicators and ratios should be taken into account.
| Name, INN, region | Revenue, billion RUB | Net profit (loss), billion RUB | Net profit ratio, % | Solvency index Globas | |||
| 2017 | 2018 | 2017 | 2018 | 2017 | 2018 | ||
| 1 | 2 | 3 | 4 | 5 | 6 | 7 | 8 |
| LLC MKK MOL BULAK INN 7728744752 Moscow |
|
na | |
na | |
na | 219 Strong |
| LLC MKK SIBIRINVEST INN 5408271207 Novosibirsk region |
|
na | |
na | |
na | 228 Strong |
| ANO RRAPP INN 6164109350 Rostov region |
|
na | |
na | |
na | 239 Strong |
| LLC MFK PROSTODENGI INN 4205219217 Novosibirsk region |
|
|
|
|
|
na | 211 Strong |
| LLC MKK KASSA №1 INN 274169217 The Republic of Bashkortostan |
|
|
|
|
|
|
227 Strong |
| LLC MFK 4FINANS INN 7724351447 Moscow In process of reorganization in the form of acquisition of other legal entities, 17/07/2019 |
|
na | |
na | |
na | 284 Medium |
| LLC MONEY MAN INN 7704784072 Moscow |
|
na | |
na | |
na | 257 Medium |
| LLC MFK VEBBANKIR INN 7733812126 Moscow |
|
na | |
na | |
na | 279 Medium |
| LLC MKK DZHET MANI MIKROFINANS INN 5042119198 Moscow |
|
|
|
|
|
|
336 Adequate |
| NAO MKK DENGI SRAZU INN 6454074861 Saratov region |
|
|
|
|
|
|
230 Strong |
| Total for TOP-10 companies | |
|
|||||
| Average value for TOP-10 companies | |
|
|
||||
| Average industry value | |
|
81,74 | ||||
![]() growth of indicator in comparison with prior period,
growth of indicator in comparison with prior period, ![]() decline of indicator in comparison with prior period.
decline of indicator in comparison with prior period.
In 2017, the average value of net profit ratio for TOP-10 companies is lower than average industry value: four companies improved the results.
*) 2018 data is for the reference.
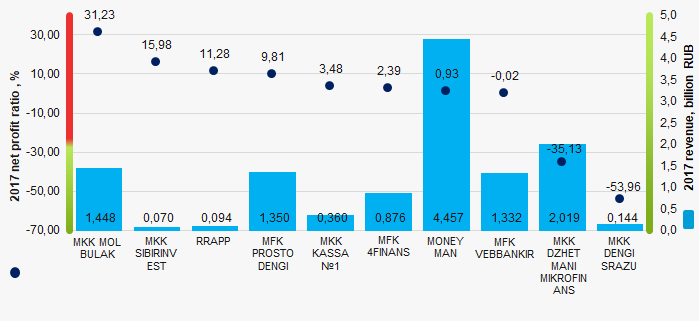 Picture 1. Net profit ratio and revenue of the largest microfinance companies (ТОP-10)
Within 7 years, the average industry indicators of the net profit ratio showed the growing tendency. (Picture 2).
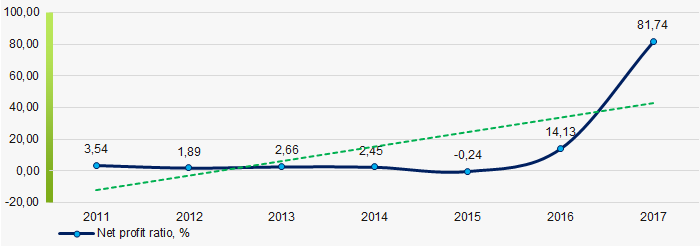 Picture 2. Change in average industry values of the net profit ratio of microfinance companies in 2011 – 2017