
Order a report
Custom-made industry research, company ratings, competitor analysis


Equity turnover ratio of the largest Russian wholesalers of information technology and telecommunications equipment
Information agency Credinform prepared a ranking of the largest Russian wholesalers of information technology and telecommunications equipment. Companies with the highest volume of revenue (TOP-10) were selected for the ranking, according to the data from the Statistical Register for the latest available periods (2016 and 2015). The enterprises were ranked by equity turnover ratio (Table 1). The analysis was based on data from the Information and Analytical system Globas.
Equity turnover ratio (times) is calculated as a relation of revenue to annual average sum of equity and demonstrates the company’s usage rate of all available assets.
Equity turnover ratio reflects the turnover rate of own capital. High value of the indicator shows the effectiveness of use of own funds. Accordingly, low ratio value indicates idleness of the part of own funds.
Taking into account the actual situation both in economy in general and in the sector, the experts of the Information agency Credinform have developed and implemented in the Information and Analytical system Globas the calculation of practical values of financial ratios, which can be recognized as normal for a particular industry. The practical value of assets turnover ratio for wholesalers of information technology and telecommunications equipment in 2016 is from 15,23 times.
For the most complete and objective view of the financial condition of the enterprise it is necessary to pay attention to the complex indicators and financial ratios of the company.
| Name, INN, region | Revenue, mln RUB | Net profit, mln RUB | Equity turnover ratio, times | Solvency index Globas | |||
| 2015 | 2016 | 2015 | 2016 | 2015 | 2016 | ||
| 1 | 2 | 3 | 4 | 5 | 6 | 7 | 8 |
| LLC MADZHESTIK INN 7701621619 Moscow |
15 981,6 | 11 867,4 | 1,7 | 4,5 | 2 946,74 | 1 390,11 | 213 Strong |
| LLC BERKS INN 7743856281 Moscow |
8 770,5 | 29 988,3 | 12,8 | 20,4 | 730,08 | 710,45 | 240 Strong |
| LLC SOYUZUNIVERSAL INN 7701153505 Moscow |
27 374,7 | 25 208,6 | 200,0 | -68,3 | 203,83 | 125,95 | 550 Insufficient (bankruptcy case is considering) |
| LLC MARVEL KT INN 7811365157 Moscow |
28 674,9 | 63 877,9 | 122,1 | 2 407,6 | 223,32 | 64,85 | 211 Strong |
| LLC O-C-S-TSENTR INN 7701341820 Moscow |
73 934,8 | 92 616,8 | 773,5 | 999,6 | 18,75 | 19,99 | 213 Strong |
| LLC APPLE RUS INN 7707767220 Moscow |
74 520,9 | 123 565,1 | 7,2 | 6 452,2 | 14,08 | 9,98 | 196 High |
| JSC JET INFOSYSTEMS INN 7729058675 Moscow |
10 204,5 | 13 443,2 | 542,5 | 1 338,5 | 12,55 | 7,98 | 162 Superior |
| JSC CROC INCORPORATED INN 7701004101 Moscow |
23 090,1 | 24 095,8 | 383,2 | 353,1 | 7,06 | 7,24 | 188 High |
| JSC ASTEROS INN 7721163646 Moscow |
9 383,8 | 10 556,6 | 252,2 | 269,4 | 6,42 | 6,42 | 212 Strong |
| LLC MARVEL COMPANY INN 7811070820 Moscow |
12 646,2 | 11 147,5 | 9,4 | -1 081,6 | 39,53 | -51,55 | 600 Insufficient (in process of liquidation, 01.06.2017) |
| Total for TOP-10 | 284 582,1 | 406 367,0 | 2 304,6 | 10 695,4 | |||
| Average value for TOP-10 companies | 28 458,2 | 40 636,7 | 230,5 | 1 069,5 | 420,24 | 229,14 | |
| Average value for industry | 161,1 | 155,1 | 0,7 | 23,7 | 19,70 | 11,91 | |
Average value of equity turnover ratio for TOP-10 is notably higher than the industry average. Compared to the previous period, two companies in TOP-10 have increased revenue and net profit figures (marked with green in columns 2 – 5 Table 1). The rest of companies decreased revenue or net profit, or have losses (filled with red in columns 2 – 5 Table 1).
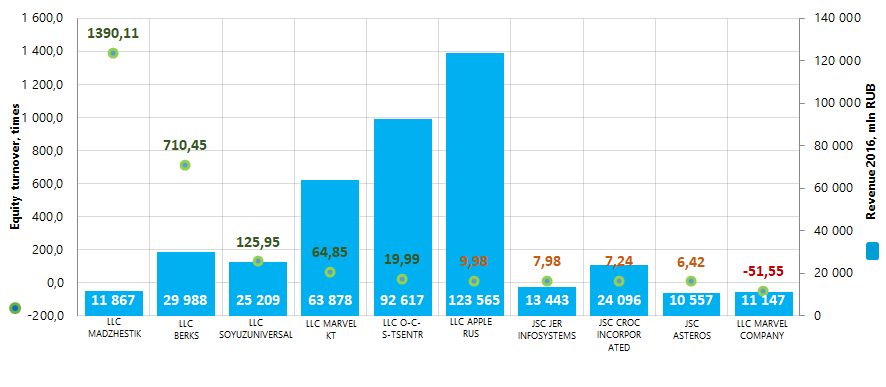 Picture 1. Equity turnover ratio and revenue of the largest Russian wholesalers of information technology and telecommunications equipment (TOP-10)
The average industry indicators of equity turnover ratio over the past 10 years were above practical value of 2016 with trend to decrease (Picture 2).
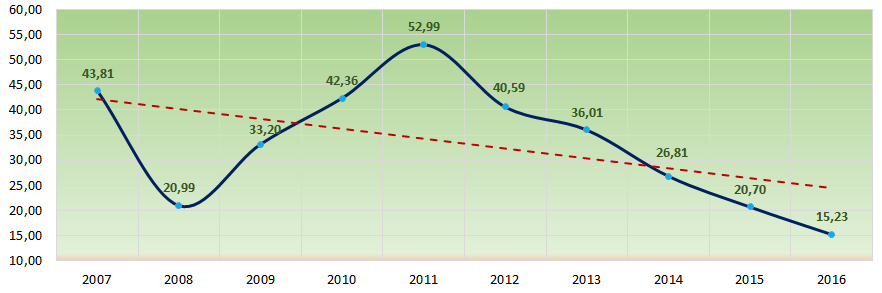 Picture 2. Change in average industry values of equity turnover ratio of the largest Russian wholesalers of information technology and telecommunications equipment in 2007 – 2016