
Order a report
Custom-made industry research, company ratings, competitor analysis


Profitability of metallic ores mining
Information agency Credinform presents a ranking of the largest Russian metallic ores mining companies. The companies with the largest volume of annual revenue (TOP-10) were selected for the ranking, according to the data from the Statistical Register for the latest available periods (2015 - 2017). Then they were ranked by product profitability ratio (Table 1). The analysis is based on data of the Information and Analytical system Globas.
Profitability ratio is calculated as the relation of sales revenue to expenses from ordinary activity. Profitability in general indicates the economic efficiency of production. The analysis of product profitability allows to conclude about the expediency of release of products or services. There are no normative values for indicators of this group, because they vary strongly depending on the industry.
The experts of the Information agency Credinform, taking into account the actual situation both in the economy as a whole and in sectors, has developed and implemented in the Information and Analytical system Globas the calculation of practical values of financial ratios that can be recognized as normal for a particular industry. For metallic ores mining companies the practical value of product profitability ratio was from 53,33 % in 2017.
For getting of the most comprehensive and fair picture of the financial standing of an enterprise it is necessary to pay attention to all combination of indicators and financial ratios.
| Name, INN, region, activity type | Sales revenue, bln RUB | Net profit (loss), bln RUB | Product profitability ratio, % | Solvency index Globas | |||
| 2016 | 2017 | 2016 | 2017 | 2016 | 2017 | ||
| 1 | 2 | 3 | 4 | 5 | 6 | 7 | 8 |
| JSC STOILENSKY GOK INN 3128011788 Belgorod region Open pit mining of iron ores |
|
|
|
|
|
|
193 High |
| LLC NOVOANGARSKY DRESSING PLANT INN 2426003607 Krasnoyarsk territory Mining and preparation of lead-zink ore |
|
|
|
|
|
|
163 Superior |
| JSC LEBEDINSKIY MINING AND PROCESSING PLANT INN 3127000014 Belgorod region Open pit mining of iron ores |
|
|
|
|
|
|
227 Strong |
| JSC MIKHAILOVSKY GOK INN 4633001577 Kursk region Open pit mining of iron ores |
|
|
|
|
|
|
157 Superior |
| JSC KARELSKY OKATYSH INN 1004001744 Republic of Karelia Open pit mining of iron ores |
|
|
|
|
|
|
167 Superior |
| JSC KOVDORSKY GOK INN 5104002234 Murmansk region Open pit mining of iron ores |
|
|
|
|
|
|
220 Strong |
| JSC EVRAZ KACHKANARCKY ORE MINING AND PROCESSING PLANT INN 6615001962 Sverdlovsk region Open pit mining of iron ores |
|
|
|
|
|
|
198 High |
| JSC GAI MINING AND PROCESSING PLANT INN 5604000700 Orenburg region Mining and preparation of copper ore |
|
|
|
|
|
|
252 Medium |
| JSC UCHALINSKY GOK INN 0270007455 The Republic of Bashkortostan Mining and preparation of copper ore |
|
|
|
|
|
|
231 Strong |
| JSC SEVURALBOKSITRUDA INN 6631001159 Sverdlovsk region Mining and preparation of aluminic raw materials (bauxites and nepheline-apatite ores) |
|
|
|
|
|
|
234 Strong |
| Total by TOP-10 companies | |
|
|
|
|||
| Average value by TOP-10 companies | |
|
|
|
|
|
|
| Industry average value | |
|
|
|
|
|
|
![]() — growth decrease of indicator to the previous period,
— growth decrease of indicator to the previous period, ![]() — decrease of indicator to the previous period.
— decrease of indicator to the previous period.
The average indicator of the product profitability ratio of TOP-10 companies is above the industry average value and the practical one. In 2017 five companies out of TOP-10 have improved their indicators compared to the previous period.
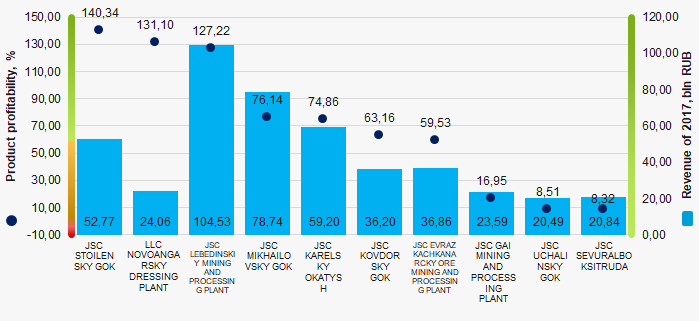 Picture 1. Product profitability ratio and revenue of the largest Russian metallic ores mining companies (TOP-10)
Over the past 10 years the industry average values of the product profitability ratio have decreasing trend (Picture 2).
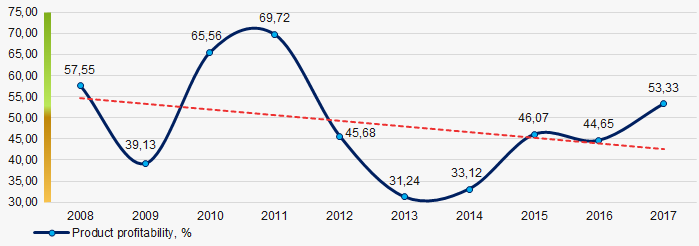 Picture 2. Change in the average industry values of the product profitability ratio of the largest Russian metallic ores mining companies in 2008 – 2017