
Order a report
Custom-made industry research, company ratings, competitor analysis


Trends in activity of the largest companies of the real economy sector of Sverdlovsk region
Information Agency Credinform Credinform has prepared the review of trends in activity of the largest companies of the real economy sector of Sverdlovsk region.
The largest enterprises (TOP-10 and TOP-1000) in terms of annual revenue were selected according to the data from the Statistical Register for the latest available periods (2014-2016). The analysis was based on data of the Information and Analytical system Globas.
Net assets are the indicator, reflecting the real value of company’s property. It is calculated annually as the difference between assets on the enterprise balance and its debt obligations. The indicator of net assets is considered negative (insufficiency of property), if company’s debt exceeds the value of its property.
| Position in ТОP-1000 | Name, activity | Net asset value, bln RUB* | Solvency index Globas | ||
| 2014 | 2015 | 2016 | |||
| 1 | 2 | 3 | 4 | 5 | 6 |
| 1. | NAO EVRAZ NIZHNY TAGIL METALLURGICAL PLANT Manufacture of crude iron, ferroalloy, steel |
118,1 | 161,0 | 175,1 | 198 High |
| 2. | JOINT STOCK COMPANY FEDERAL FREIGHT Renting and leasing of railway transport and equipment |
81,9 | 73,3 | 79,1 | 211 Strong |
| 3. | NAO URAL ELECTROCHEMICAL INTEGRATED PLANT Processing of nuclear fuel |
57,8 | 63,8 | 70,6 | 145 Superior |
| 4. | NAO EVRAZ KACHKANARCKY ORE MINING AND PROCESSING PLANT Opencast mining of iron ores |
73,6 | 67,7 | 67,5 | 233 Strong |
| 5. | PAO Enel Russia Production of electricity by heat power plants, including activities on the ensuring availability of power plants |
61,7 | 57,0 | 62,1 | 182 High |
| 996. | THE URALMASHPLANT JOINT-STOCK COMPANY Manufacture of machinery for mining and construction |
0,8 | -1,7 | -2,7 | 298 Medium |
| 997. | NAO SVERDLOVSK SUBURBAN COMPANY Passenger rail transport, interurban and international |
-3,1 | -2,9 | -2,9 | 266 Medium |
| 998. | LLC HOTEL DEVELOPMENT COMPANY Hotels and similar accommodation |
-3,8 | -4,2 | -4,2 | 316 Adequate |
| 999. | PAO NADEZHDINSKII METALLURGICHESKII ZAVOD Manufacture of sectional hot-rolled steel and wire rods |
-3,3 | -5,4 | -6,6 | 248 Strong |
| 1000. | UMMC-STEEL CORPORATION Manufacture of sectional hot-rolled steel and wire rods |
-12,4 | -20,8 | -21,7 | 327 Adequate |
* — growth/decline indicators in comparison with prior period are marked green and red in columns 4 and 5 respectively.
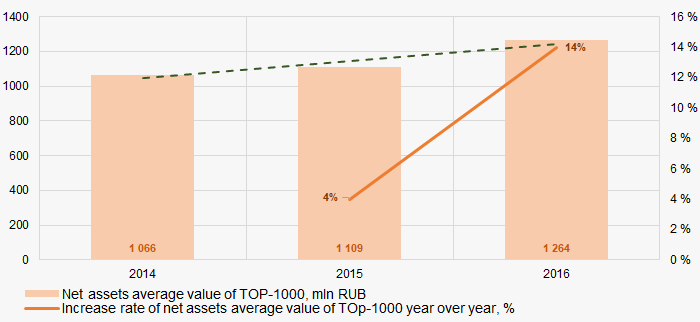 Picture 1. Change in average net assets value of the largest companies of the real economy sector of Sverdlovsk region in 2014 — 2016
Sales revenue
In 2016 total revenue of 10 largest companies amounted to 26% from TOP-1000 total revenue (Picture 2).
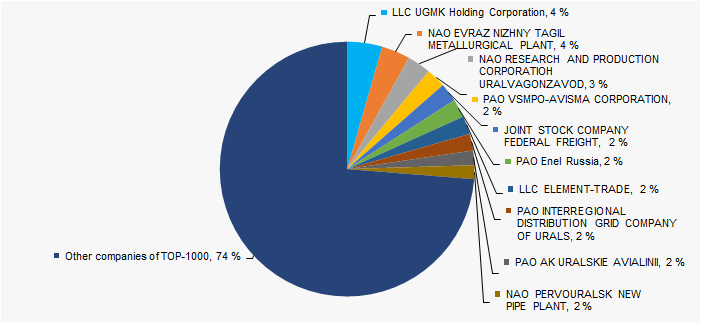 Picture 2. Shares of TOP-10 companies in TOP-1000 total revenue for 2016
The increase in sales revenue is observed (Picture 3).
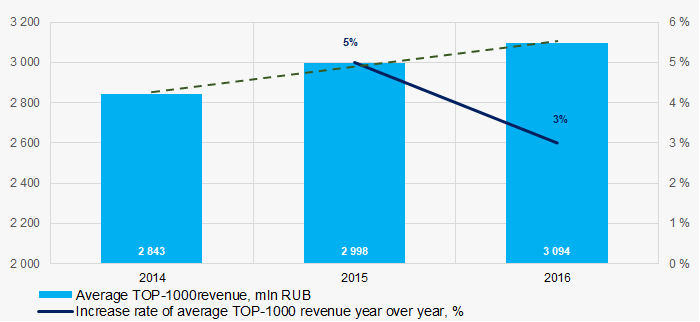 Picture 3. Change in average revenue of the largest companies of the real economy sector of Sverdlovsk region in 2014 — 2016
Profit and loss
In 2016, profit of 10 largest companies amounted to 54% from TOP-1000 total profit (Picture 4).
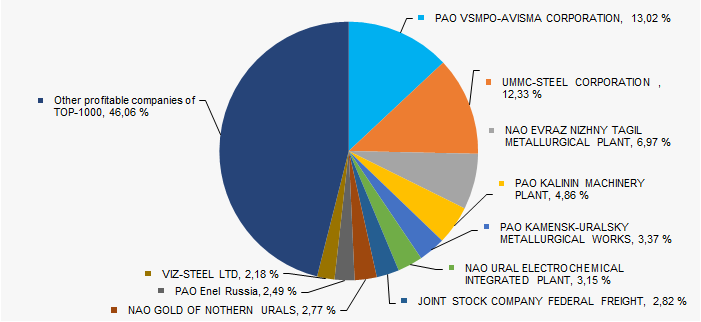 Picture 4. Shares of TOP-10 companies in TOP-1000 total profit for 2016
For the three-year period, the average revenue values of TOP-1000 companies show the growing tendency and the average net loss decreases (Picture 5).
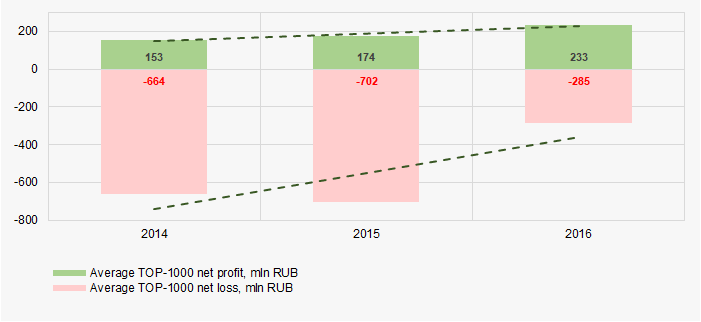 Picture 5. Change in average profit/loss of the largest companies of the real economy sector of Sverdlovsk region in 2014 — 2016
Main financial ratios
Current liquidity ratio (ratio of total working capital to short-term liabilities) shows the sufficiency of company’s assets to meet short-term obligations.
For 2015 — 2016 period the average values of current liquidity ratio of TOP-1000 were higher than recommended values — from 1,0 to 2,0 with the growing tendency (Picture 6).
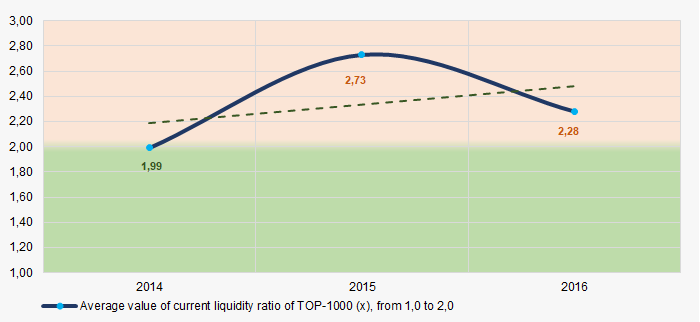 Picture 6. Change in average values of current liquidity ratio of the largest companies of the real economy sector of Sverdlovsk region in 2014 — 2016
The ROI ratio is calculated as a ratio of net profit to sum of stockholder equity and long-term liabilities and shows the return from equity involved in commercial activities and long-term borrowed funds.
For the three-year period, the increasing tendency of ROI ratio is observed (Picture 7).
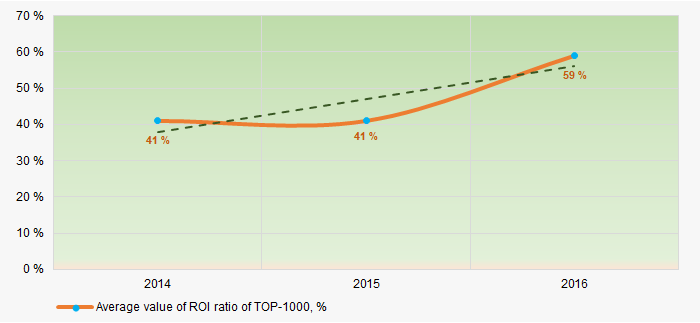 Picture 7. Change in average values of ROI ratio of the largest companies of the real economy sector of Sverdlovsk region in 2014 — 2016
Assets turnover ratio is the ratio of sales revenue and company’s average total assets for a period. It characterizes the effectiveness of using of all available resources, regardless the source of their attraction. The ratio shows how many times per year the full cycle of production and circulation is performed, generating the corresponding effect in the form of profit.
For the three-year period, this business activity ratio demonstrated the downward trend (Picture 8).
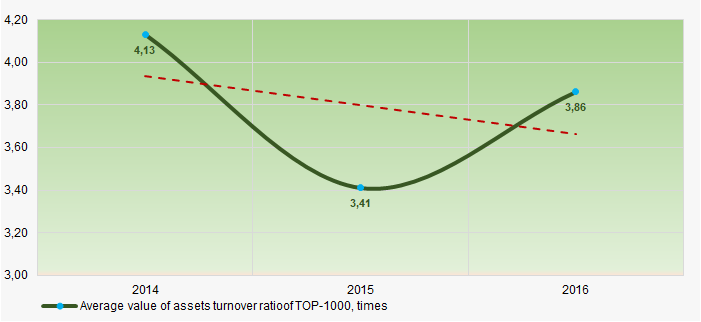 Picture 8. Change in average values of assets turnover ratio of the largest companies of the real economy sector of Sverdlovsk region in 2014 — 2016
Production and services structure
The largest share in TOP-1000 total revenue take companies engaged in metallurgical production and wholesale trade (Picture 9).
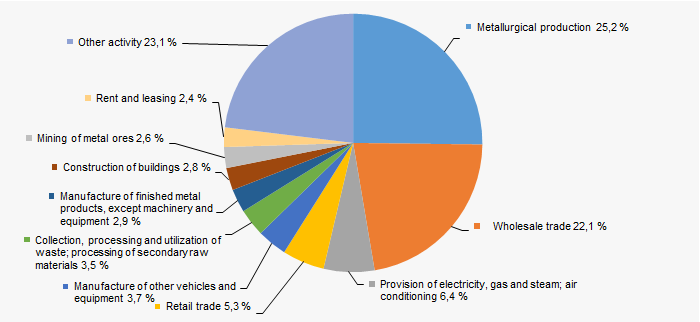 Picture 9. Distribution of activities in TOP-1000 total revenue, %
53% of TOP-1000 companies are registered in the Register of Small and Medium-Sized Business Entities of Federal Tax Service of the Russian Federation, among them 26% have status of medium-sized enterprises, 27% are classified as small enterprises and less than 1% are referred to microenterprises.
Financial position score
The assessment of company’s financial position shows that more than a half of companies have stable or above average financial position (Picture 10).
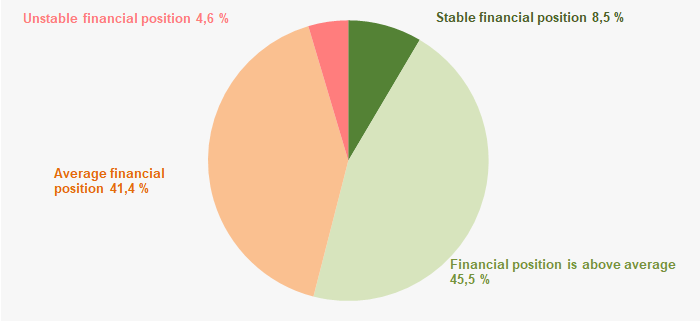 Picture 10. Distribution of TOP-1000 companies by financial position score
Solvency index Globas
The majority of TOP-1000 companies have superior/high or strong/medium solvency index Globas, this fact shows the ability of the companies to meet their obligations in time and fully (Picture 11).
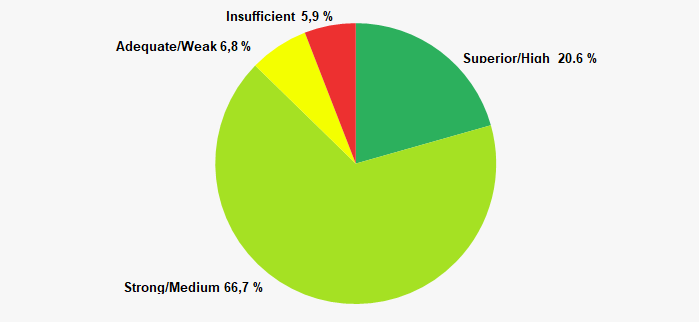 Picture 11. Distribution of TOP-1000 companies by solvency index Globas
Conclusion
Hereby, the complex assessment of the largest real economy companies of Sverdlovsk region, taking into account main indexes, financial ratios and indicators, demonstrates the denomination of favorable trends.