TOP-1000 companies of the North Caucasus
In order to reduce interregional differences in the level and quality of life of the population, accelerate the rate of economic growth and technological development, as well as to ensure the national security of the country, the Government of the Russian Federation approved the strategy of spatial development of Russia until 2025, consisting of 12 macro-regions, in February 2019. One of them is the North Caucasus region, which includes: Sevastopol, Kabardino-Balkaria, Karachayevo-Cherkessian and Chechen Republics, Krasnodar and Stavropol territories, Republic of Adygea, Dagestan, Ingushetia, Crimea, Republic of North Ossetia-Alania, Rostov region.
Information agency Credinform represents an overview of activity trends of the largest enterprises of the real sector of the economy in the North Caucasus economic region of Russia.
Enterprises with the largest volume of annual revenue (TOP-1000) were selected for the analysis, according to the data from the Statistical Register for the latest available periods (for 2013 - 2018). The analysis was made on the basis of the data of the Information and Analytical system Globas.
Net assets value is an indicator, reflecting the real value of company’s property, is calculated annually as the difference between assets on the enterprise balance and its debt obligations. The indicator of net assets is considered negative (insufficiency of property), if company’s debt exceeds the value of its property.
The largest enterprise of the North Caucasus economic region of Russia in terms of net assets is GAZPROM TRANSGAZ KRASNODAR LLC, INN 2308128945, Krasnodar territory. Its net assets amounted to more than 206 billion rubles in 2018.
The smallest amount of net assets in the TOP-1000 list was hold by GAZPROM MEZHREGIONGAZ GROZNY LLC, INN 2013006003, Chechen Republic. The insufficiency of property of this company in 2018 was expressed as a negative value of -83 billion rubles.
The average values of net assets of TOP-1000 enterprises tend to increase over the five-year period (Picture 1).
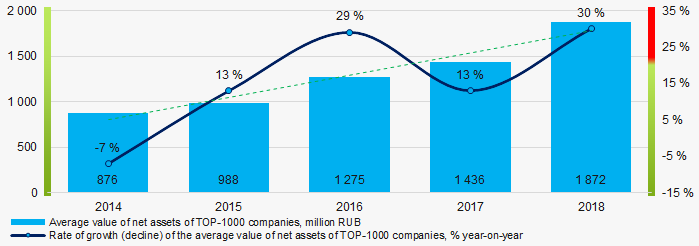 Picture 1. Change in the average indicators of the net asset value of TOP-1000 companies in 2014 – 2018
The shares of TOP-1000 enterprises with insufficiency of assets have a tendency to decrease in the last five years (Picture 2).
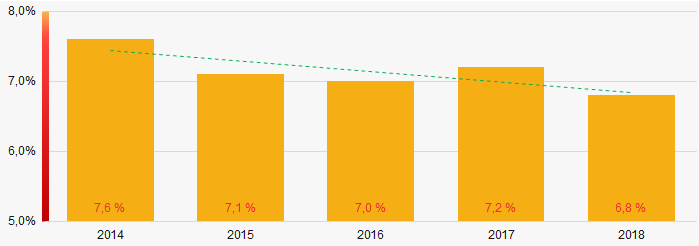 Picture 2. Shares of enterprises with negative values of net assets in TOP-1000
Sales revenue
The revenue volume of 10 leading companies of the region made almost 37% of the total revenue of TOP-1000 in 2018 (Picture 3). It points to a relatively high level of capital concentration.
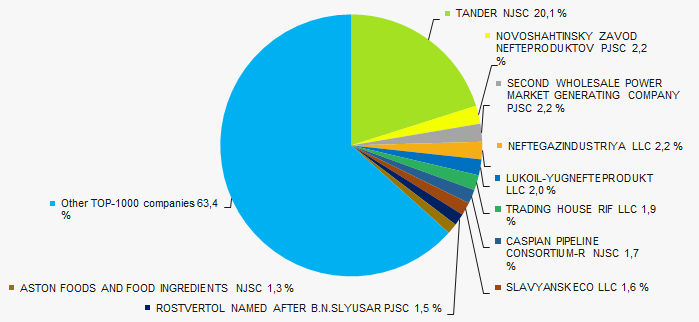 Picture 3. Shares of participation of TOP-10 companies in the total revenue of TOP-1000 enterprises for 2018
 In general, there is a tendency to increase in the revenue volumes (Picture 4).
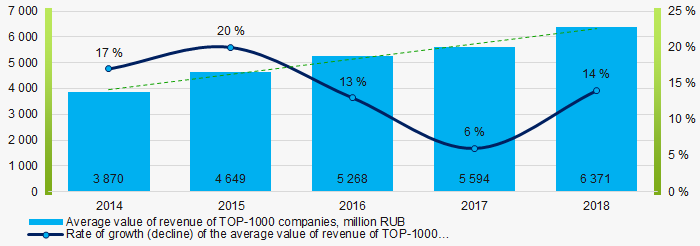 Picture 4. Change in the average revenue of TOP-1000 companies in 2014 – 2018Change in the average revenue of TOP-1000 companies in 2014 – 2018
Profit and losses
The largest company in terms of net profit value is CASPIAN PIPELINE CONSORTIUM-R NJSC, INN 2310040800, Krasnodar territory. Company's profit amounted to more than 36 billion rubles in 2018.
Over a five-year period, TOP-1000 enterprises showed a tendency to growth of profit (Picture 5).
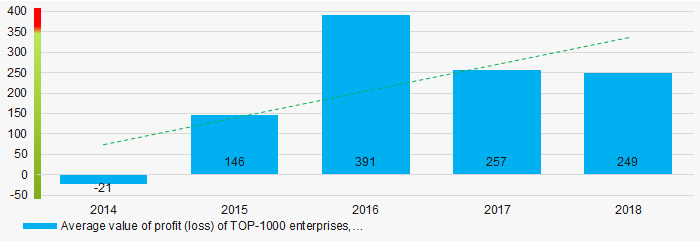 Picture 5. Change in the average indicators of profit of TOP-1000 companies in 2014 – 2018
Average values of net profit’s indicators of TOP-1000 enterprises have a tendency increase over a five-year period, at the same time the average value of net loss decreases. (Picture 6).
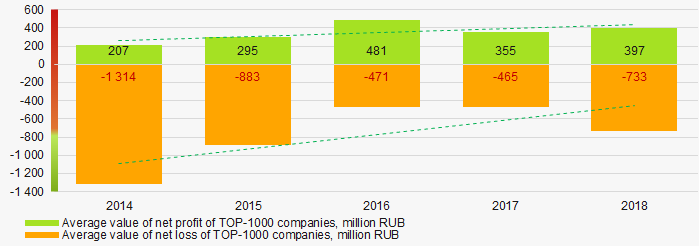 Picture 6. Change in the average indicators of net profit and net loss of TOP-1000 companies in 2014 – 2018
 Key financial ratios
Over the five-year period, the average indicators of the total liquidity of TOP-1000 enterprises were above the range of recommended values - from 1,0 up to 2,0, with a tendency to increase. (Picture 7).
The total liquidity ratio (the relation of the amount of current assets to short-term liabilities) shows the sufficiency of company’s funds for repayment of its short-term liabilities.
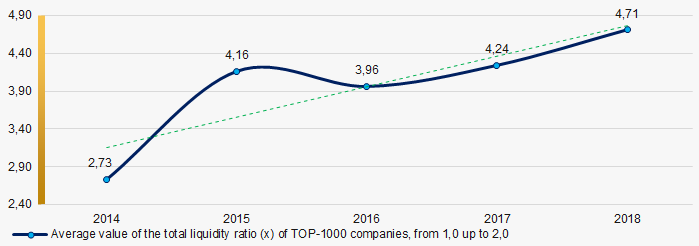 Picture 7. Change in the average values of the total liquidity ratio of TOP-1000 companies in 2014 – 2018
Over the course of five years, there is a rather high level of average indicators of return on investment ratio, with a tendency to decrease (Picture 8).
The ratio is calculated as the relation of net profit to the sum of own capital and long-term liabilities and demonstrates the return on the equity involved in the commercial activity and the long-term borrowed funds of an organization.
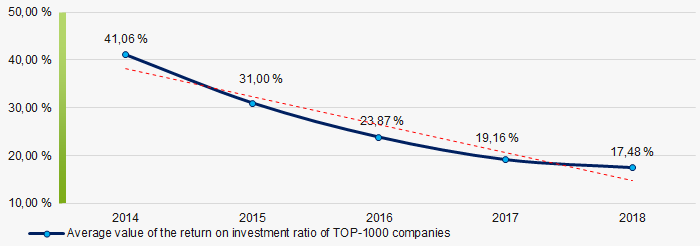 Picture 8. Change in the average values of the return on investment ratio of TOP-1000 companies in 2014 – 2018
 Asset turnover ratio is calculated as the relation of sales proceeds to the average value of total assets for a period and characterizes the efficiency of use of all available resources, regardless of the sources of their attraction. The ratio shows how many times a year a complete cycle of production and circulation is made, yielding profit.
Over a five-year period, this indicator of business activity showed a tendency to decrease (Picture 9).
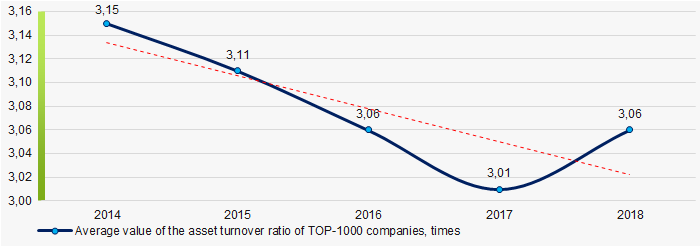 Picture 9. Change in the average values of the asset turnover ratio of TOP-1000 companies in 2014 – 2018
Small business
30% enterprises from TOP-1000 are registered in the Register of small and medium-sized enterprises of the Federal Tax Service of the RF. At the same time, their share in the total revenue of TOP-1000 amounts to 6%, that is significantly lower than the national average one in 2018 - 2019. (Picture 10).
 Picture 10. Shares of proceeds of small and medium-sized enterprises in TOP-1000 companies
Main regions of activity
TOP-1000 companies are registered in all 12 regions and distributed unequal across the territory. 84% of the largest enterprises in terms of revenue are concentrated in Krasnodar territory and Rostov region (Picture 11).
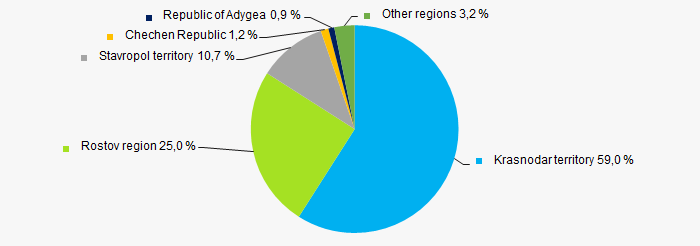 Picture 11. Distribution of the revenue of TOP-1000 companies by regions of the North Caucasus economic region of Russia
Financial position score
An assessment of the financial position of TOP-1000 companies shows that the financial position of the most of them is above average. (Picture 12).
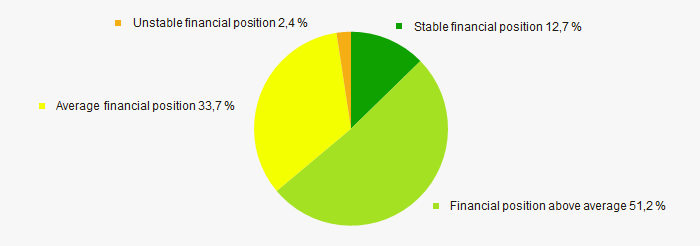 Picture 12. Distribution of TOP-1000 companies by financial position score
Solvency index Globas
The vast majority of TOP-1000 enterprises got Superior/High or Strong/Medium Solvency index Globas, that points to their ability to pay off their debts in time and fully (Picture 13).
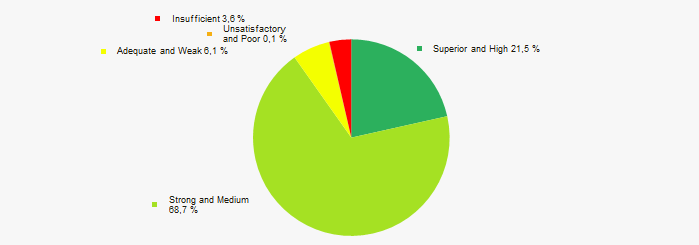 Picture 13. Distribution of TOP-50 companies by solvency index Globas
Industrial production index
According to the Federal State Statistics Service, there is a tendency towards a decrease in indicators of the industrial production index in the North Caucasus economic region of Russia during 12 months of 2019 – 2020 (Picture 14). At the same time, the average index month-over-month made 99,7%.
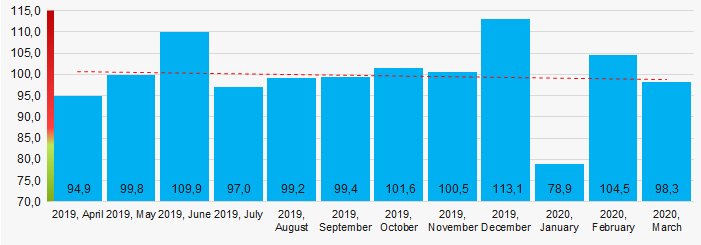 Picture 14. Averaged industrial production index in the territory of the North Caucasus economic region of Russia in 2019 - 2020, month-over-month (%)
According to the same data, the share of enterprises of the North Caucasus economic region of Russia in the total amount of revenue from the sale of goods, works, services made 4,643% countrywide for 2019, that is lower than the indicator for 2018, which amounted to 4,701%.
Conclusion
A comprehensive assessment of activity of the largest enterprises of the real sector of the economy in the North Caucasus economic region of Russia, taking into account the main indices, financial indicators and ratios, points to the prevalence of positive trends (Table 1).
| Trends and evaluation factors of TOP-1000 | Specific share of factor, % |
| Rate of growth (decline) in the average size of net assets |  10 10 |
| Increase / decrease in the share of enterprises with negative values of net assets |  10 10 |
| Level of competition / monopolization |  -10 -10 |
| Rate of growth (decline) in the average size of revenue |  10 10 |
| Rate of growth (decline) in the average size of profit (loss) |  10 10 |
| Growth / decline in average values of net profit of companies |  10 10 |
| Growth / decline in average values of net loss of companies |  10 10 |
| Increase / decrease in average values of total liquidity ratio | |
| Increase / decrease in average values of return on investment ratio |  -10 -10 |
| Increase / decrease in average values of asset turnover ratio, times |  -10 -10 |
| Share of small and medium-sized enterprises in the region in terms of revenue being more than 22% |  -10 -10 |
| Regional concentration |  -10 -10 |
| Financial position (the largest share) |  10 10 |
| Solvency index Globas (the largest share) |  10 10 |
| Industrial production index |  -10 -10 |
| Dynamics of the share of proceeds of the region in the total revenue of the RF |  -10 -10 |
| Average value of the specific share of factors |  0,9 0,9 |
 positive trend (factor),
  negative trend (factor).
Top-10 of the largest Russian companies engaged in electric power transmission by revenue
Information agency Credinform has prepared a ranking of the largest Russian companies engaged in electric power transmission. On the base of the Information and Analytical system Globas, Тоp-10 companies engaged in electric power transmission and technological connection to distribution systems were selected by the experts in terms of the maximum revenue for 2019. Then the experts made the analysis of financial position of each enterprise and assessed the market condition.
The electric-power industry in Russia is the sector of economy, which assumes the existence of a system of economic relations arising in various processes related to electric power - production, transmission, management, sale and consumption. The main aim of the industry is providing of electrification based on rationality in production and use of electric power.
The market of electric power in Russia has the complex structure and organizations in the industry are divided into:
- power generating companies (electric power generation);
- distributors (electric power sale);
- grid companies (electric power transmission).
The ranking includes only grid companies, in other words, according to the Credinform data, the actual activities of the companies are electric power transmission and technological connection to distribution systems.
According to the Information and Analytical system Globas, Тоp-10 companies in terms of 2018 annual revenue take only 58.2% of the market (989,5 billion RUB), this testifies the high concentration in the field of electricity transmission and the difficult situation for new market participants.
| № | Name | 2019 revenue, billion RUB | 2019 net profit, billion RUB | Solvency index | |
| 1 | JSC FEDERAL GRID COMPANY OF UNIFIED ENERGY SYSTEM Moscow |
242,7 | + 1,0 % | 58,1 | 150 Superior |
| 2 | JSC MOSCOW UNITED ELECTRIC GRID COMPANY Moscow |
160,3 | + 2,5 % | 6,6 | 178 High |
| 3 | JSC IDGC of Centre and Volga Region Nizhniy Novgorod |
96,3 | + 2,6 % | 5,1 | 194 High |
| 4 | JSC INTERREGIONAL DISTRIBUTION GRID COMPANY OF CENTRE Moscow |
94,5 | + 0,7 % | 0,214 | 251 Medium |
| 5 | JSC INTERREGIONAL DISTRIBUTION GRID COMPANY OF URALS Yekaterinburg |
94,0 | + 4,9 % | 2,1 | 203 Strong |
| 6 | JSC LENENERGO Saint Petersburg |
82,3 | + 7,8 % | 12,7 | 199 High |
| 7 | JSC Rosseti Tyumen Surgut |
63,4 | + 8,3 % | - 0,533 | 258 Medium |
| 8 | JSC Interregional Distribution Grid Company of Volga Saratov |
62,8 | - 1,1 % | 2,6 | 194 High |
| 9 | JSC Interregional Distribution Grid Company of Siberia Krasnoyarsk |
57,4 | + 3,4 % | - 0,735 | 276 Medium |
| 10 | JSC KUBAN POWER AND ELECTRIFICATION Krasnodar |
51,0 | + 9,9 % | 2,4 | 214 Strong |
It is remarkable that, top-10 of grid companies are the subsidiaries of JSC «ROSSETI». «ROSSETI» holding, excluding the share in JSC FEDERAL GRID COMPANY OF UNIFIED ENERGY SYSTEM, is the operator of energy networks and related equipment. In fact, the holding controls 15 interregional distribution grid companies. In other words, these are the power lines, which we see in urban infrastructure.
The largest grid company in Russia is JSC FEDERAL GRID COMPANY OF UNIFIED ENERGY SYSTEM, the 2019 annual revenue of the company amounted to 242,7 billion RUB. The company is located in Moscow and it accounts for more than 14 % of the revenue of all industry organizations. The net profit of the company amounted to 58,1 billion RUB, in comparison with the revenue this indicates about the company's profitability. Within the year the company's turnover increased by 1% and industry volume by 10.07%.
The increase in revenue of many grid companies in Russia is connected with increase in electricity consumption (Picture 1). From 2010 to 2018 electricity consumption increased by 9% and according to the preliminary results for 2019, the current trend is expected to continue. As for 2020 forecasts, in connection with the coronavirus pandemic, a sharp decrease in overall electricity consumption is expected.
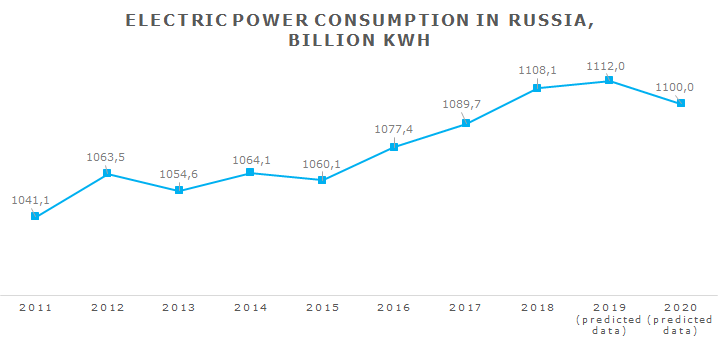 Picture 1. The dynamics of electric power consumption in Russia during 2010-2020, billion kWh
Source: Unified interdepartmental statistical information system (UISIS), estimated data by Credinform
Using the tool ‘Analysis of industry’ in the Information and Analytical system Globas, it is possible to find out another reason for the increase in revenue of top-10 grid companies. The industry volume is constantly growing and in 2018 it amounted to more than 1,6 trillion RUB. The growth of top-10 revenue in 2019 indicates about the projected growth of industry volumes.
In 2019 the significant growth of revenue by 8,3% (in comparison with 2018 Top-10 list) demonstrated JSC Rosseti Tyumen, which took the seventh place instead of ninth. However, the net loss for the last two years indicates about financial problems of the business, this is also proved by the solvency index, which is approaching the average value.
The only company in top-10 list, which demonstrated the reduction in revenue in 2019, is JSC Interregional Distribution Grid Company of Volga, the company took the eighth place instead of the seventh (in comparison with 2018). However, the highest solvency index shows that the company is still financially reliable.
The ranking shows that the field of electric power transmission is still strategically important for the country; this is confirmed by the growth of electric power consumption. The industry volumes are constantly growing, which also testifies the profitability of this market. However, considering the fact that top-10 companies take more than 90% of the market, this industry won’t be a priority for new entrepreneurs due to too high concentration of the industry.