Trends in fuel wholesale
Information agency Credinform has prepared a review of trends of the largest companies engaged in wholesale of motor fuel, including aviation fuel.The largest enterprises (TOP-10 and TOP-1000) in terms of annual revenue were selected for the analysis according to the data from the Statistical Register for the latest available periods (2015-2017). The analysis was based on the data of the Information and Analytical system Globas.
Net assets are total assets less total liabilities. This indicator reflects the real value of the property of an enterprise. When the company’s debt exceeds the value of its property, the indicator is considered negative (insufficiency of property).
The largest company in term of net assets is LLC RN-LUBRICANTS . In 2017, net assets value of the company exceeded 14,7 billion RUB.
The lowest net assets volume among TOP-1000 belonged to JSC FORTEINVEST. Insufficiency of property of the company was indicated in negative value of -8,1 billion RUB.
Covering the ten-year period, the average net assets values have a trend to increase (Picture 1).
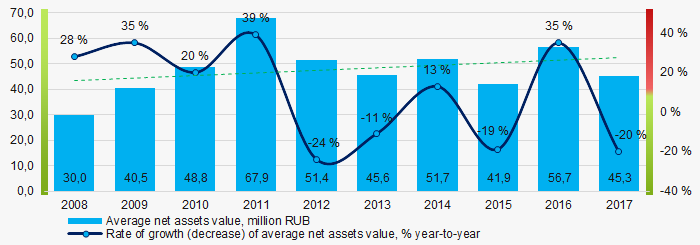 Picture 1. Change in average net assets value in 2008 – 2017
The shares of TOP-1000 companies with insufficient property have trend to decrease over the past three years (Picture 2).
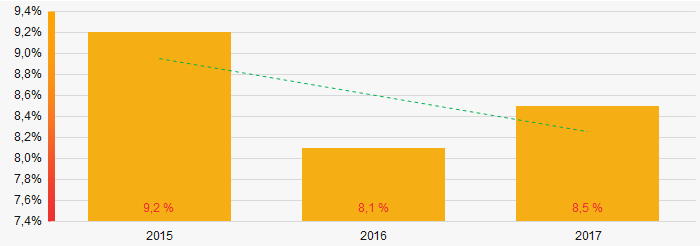 Picture 2. Shares of companies with negative net assets value in TOP-1000, 2015-2017
Sales revenue
In 2017, total revenue of 10 largest companies of was 64% of TOP-1000 total revenue (Picture 3). This testifies high level of monopolization in the industry.
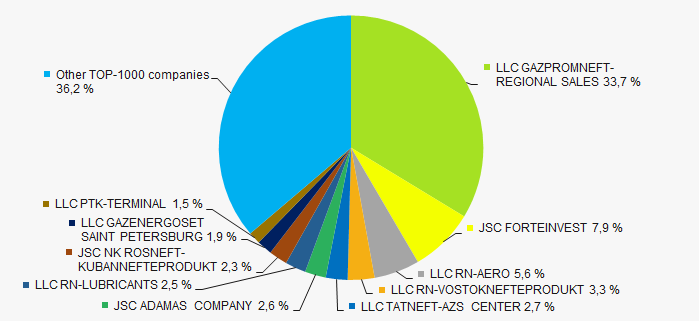 Picture 3. Shares of TOP-10 companies in TOP-1000 total profit for 2017
Covering the ten-year-period, there is an increase in industry average revenue (Picture 4).
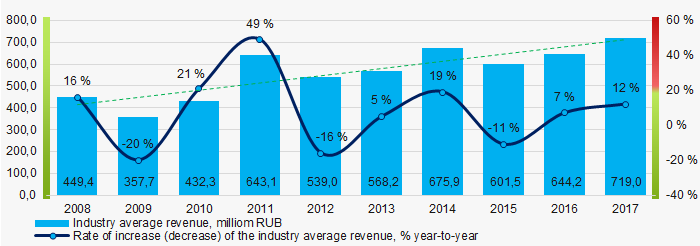 Picture 4. Change in industry average net profit in 2008-2017
Profit and loss
The largest company in term of net profit is LLC RN-AERO. The company’s profit for 2017 amounted to 14,4 billion RUB.
Over the ten-year period, there is a trend to increase in average net profit (Picture 5).
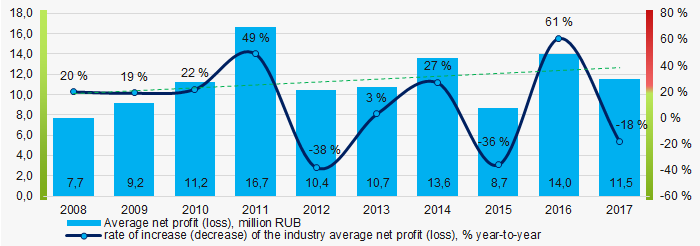 Picture 5. Change in industry average net profit values n 2008-2017
For the three-year period, the average net profit values of TOP-1000 companies decreased with the average net loss value having the decreasing trend (Picture 6).
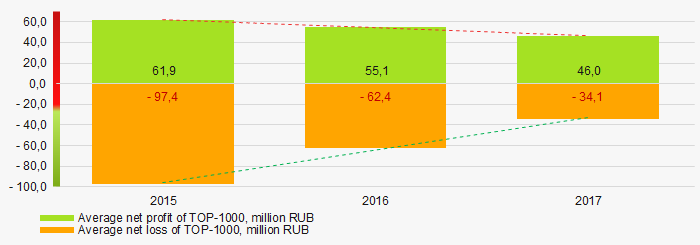 Picture 6. Change in average net profit and net loss of ТОP-1000 in 2015 – 2017
Key financial ratios
For the ten-year period, the average values of the current liquidity ratio were mainly above the recommended one - from 1,0 to 2,0 with a trend to decrease (Picture 7).
Current liquidity ratio (current assets to short-term liabilities) shows the sufficiency of company’s assets to repay on short-term liabilities.
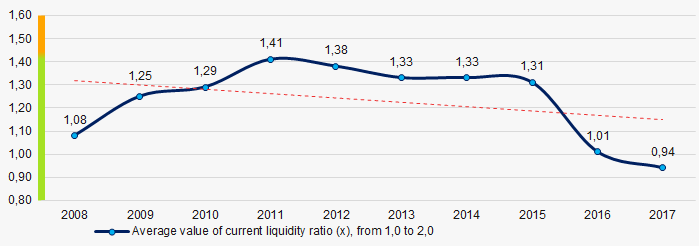 Picture 7. Change in industry average values of current liquidity ratio in 2008 – 2017
For the ten-year period, the average values of ROI ratio were on a quite high level with a trend to increase (Picture 8).
ROI ratio is calculated as net profit to sum of shareholders equity and long-term liabilities, and shows the return of equity involved in commercial activities and long-term borrowed funds.
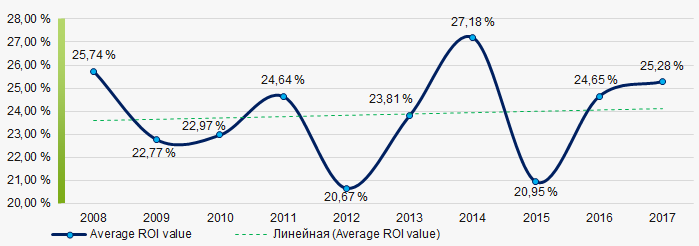 Picture 8. Change in average values of ROI ratio in 2008 – 2017
Assets turnover ratio is the ratio of sales revenue and company’s average total assets for a period. It characterizes the effectiveness of using of all available resources, regardless the source of their attraction. The ratio shows how many times per year the full cycle of production and circulation is performed, generating the corresponding effect in the form of profit.
For the ten-year period, business activity ratio demonstrated the decreasing trend (Picture 9).
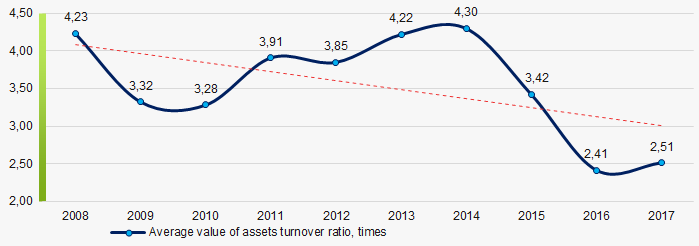 Picture 9. Change in average values of assets turnover ratio in 2008 – 2017
Small enterprises
90% companies of TOP-1000 are registered in the Register of small and medium-sized enterprises of the Federal Tax Service of the Russian Federation. At the same time, their share in total revenue for 2017 amounted to 12% that is lower than the national average figure (Picture 10).
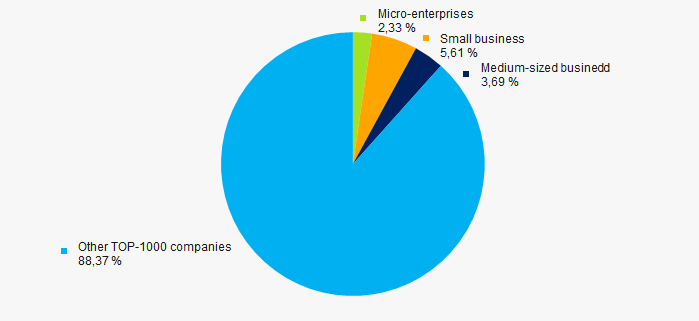 Picture 10. Shares of small and medium-sized enterprises in TOP-1000, %
Main regions of activity
Companies of TOP-1000 are registered in 79 regions of Russia and located across the country quite unequally. Over 61% of their turnover is concentrated in Saint Petersburg and Moscow (Picture 11).
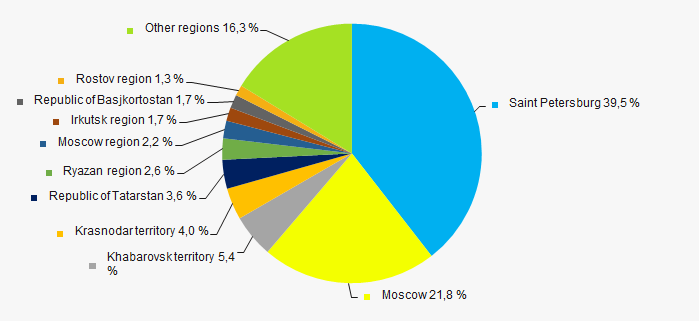 Picture 11. Distribution of TOP-1000 revenue by regions of Russia
Financial position score
Assessment of the financial position of TOP-1000 companies shows that almost a half of them have stable financial position (Picture 12).
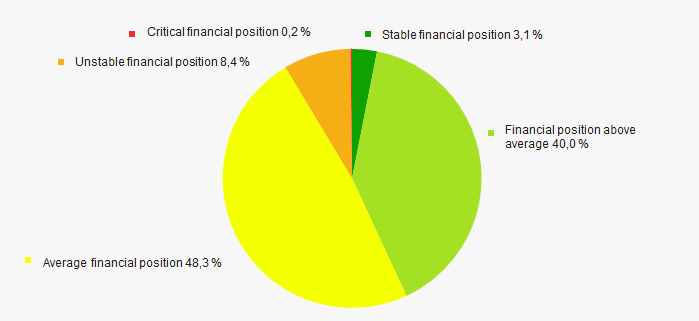 Picture 12. Distribution of TOP-1000 companies by financial position score
Solvency index Globas
Most of TOP-1000 companies got Superior / High and Strong / Medium index Globas. This fact shows their ability to meet their obligations fully (Picture 13).
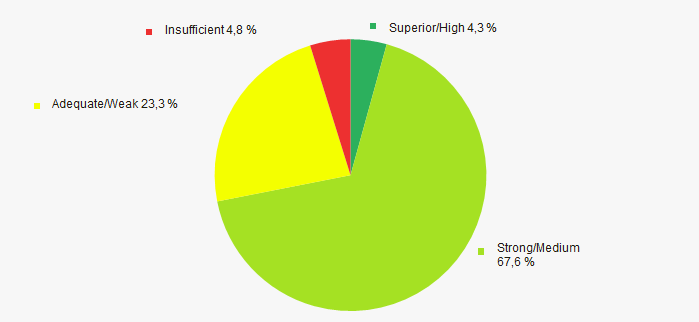 Picture 13. Distribution of TOP-1000 companies by solvency index Globas
Conclusion
Complex assessment of activity of the largest Russian companies engaged in fuel wholesale, taking into account the main indexes, financial ratios and indicators, demonstrates the prevalence of positive trends (Table 1).
| Trends and evaluation factors | Relative share of factors, % |
| Rate of growth (decline) in the average size of net assets |  10 10 |
| Increase / decrease in the share of enterprises with negative values of net assets |  10 10 |
| Rate of growth (decline) in the average size of revenue |  10 10 |
| Level of competition |  -10 -10 |
| Rate of growth (decline) in the average size of profit (loss) |  10 10 |
| Growth / decline in average values of companies’ net profit |  -10 -10 |
| Growth / decline in average values of companies’ net loss |  10 10 |
| Increase / decrease in average values of total liquidity ratio |  -5 -5 |
| Increase / decrease in average values of return on investment ratio |  10 10 |
| Increase / decrease in average values of asset turnover ratio, times |  -10 -10 |
| Share of small and medium-sized businesses in the region in terms of revenue being more than 22% |  -10 -10 |
| Regional concentration |  -10 -10 |
| Financial position (the largest share) |  5 5 |
| Solvency index Globas (the largest share) |  10 10 |
| Average value of relative share of factors |  1,4 1,4 |
 positive trend (factor),
  negative trend (factor).
Portrait of the russian business
According to the Federal Tax Service (hereinafter “FTS”) on July 1, 2019, there are 3,9 million active companies in Russia.
Summary analysis helped to create a portrait of the Russian companies and obtain an overall picture of the structure and dynamics of the economy, functioning of business environment, identify disadvantages and benefits of the current level of business community.
Details
- Profit-making companies are in the majority of legal entities in Russia: 3,2 million or 84% of total active companies. Limited liability companies (LLC) reach 3,1 million or 97%. Due to quite simple registration procedure, minimal requirements to the authorized capital and financial accounts, this legal form is prevailing.
- Joint-stock companies are slightly spread: about 67 thousand or 2% of all active profit-making enterprises. Under the low attractiveness for foreign investors, lack of free financial resources and absence of conditions for private domestic investing, the entrepreneurs do not make companies public and borrow capital on the open stock market.
- The number of companies in Russia is decreasing: on July 1, 2016, the maximum number of legal entities (4,8 million) were registered, and since then the number of active companies decreased by 905 thousand or 20% as of July 1, 2019.
- Rapid reduction in the number of organizations is not due to the slowdown in economic growth, but is a consequence of the ongoing policy of cleaning the business environment from fictitious companies. For instance, in January-July 2019 in 87.6% of cases it was the decision of the registering authority (FTS) that was the basis for excluding the company from the Unified State Register of Legal Entities (hereinafter “EGRUL”). Only 1,1% of companies leave the market due to bankruptcy, and 1,5% - after reorganization. Voluntary decision on liquidation is made only in 9,2% of cases, and 0,6% of companies become inactive for other reasons.
- According to the FTS on July 2019, about 150 thousand firms with signs of a shell company are registered. A year ago, there were 310 thousand such companies, and before the campaign against companies launched in 2017 - about 1,6 million. These significant results in clearing EGRUL of shell companies were achieved by obtaining the right by tax authorities to verify the accuracy of information entered in the register.
- Currently, about 300 thousand of active companies, i.e. each 13th company is in the process of liquidation. In addition, 13 thousand legal entities entered into the process of reorganization with subsequent liquidation. The remaining 3,6 million firms continue their operations.
- There is a high concentration of business in the capital regions: 726 thousand legal entities or 19% of the total number of operating companies are registered in Moscow, and 298 thousand companies or 8% are registered in Saint Petersburg. The main tax revenues are formed in the mentioned regions, although the production base of many of the companies is located outside these subjects.
- A significant part of operating companies has overcome the period of formation: approximately 60% of organizations were established more than 5 years ago. Companies at the age of 1 to 3 years are at business risk - 17% of the total number of companies, and up to 1 year - 8% of firms.
- Mainly, shareholders of operating companies with a controlling stake in the authorized capital of 50% and above are citizens of Russia. There are 2,4 million of such companies. Citizens of other countries with a share in the capital of more than 50% have established 86 thousand organizations.
- Legal entities with a share of more than 50% participate in the capital of 178 thousand operating organizations, 151 thousand companies of which are with Russian shareholders. Major shareholders of 8 thousand companies are registered in the Republic of Cyprus, of 2 thousand - in the Seychelles. With a general minority of foreign owners, a number of large enterprises of systemic importance for the economy are controlled from foreign offshore or low tax jurisdictions.
- The success in diversifying the country's economy is becoming obvious: by the end of 2018, only 37% of all tax revenues to the consolidated budget of the Russian Federation were contributed by companies engaged in extraction of mineral resources. The remaining 63% of taxes fell on other segments, including manufacturing industry - 16%, wholesale and retail trade - 10%.
- The category of small and medium-sized businesses in Russia includes 2,8 million operating organizations, 2,5 million of which refer to micro-enterprises.
- Despite the large number of small enterprises, Russia is a country of large companies: 68% of total annual turnover for 2018 is accumulated by the major taxpayers. The share of medium-sized organizations in total revenue is 4%, and 28% accounts for small and micro enterprises.
- Major taxpayers demonstrate the largest increase in annual revenue: compared to 2017, in 2018 their turnover increased by 27%. Medium-sized companies increased the rate by 6%, small and micro enterprises by 7% and 14%, respectively.
- Most companies in Russia have a positive financial result: in 2018, there were 73% profitable and 27% loss-making companies.
- According to the Globas, 26% of total number of operating companies have Superior/High and Strong/Medium Solvency index Globas, 34% have Adequate/Weak index, and 31% - Unsatisfactory/Poor.
Table 1. Portrait of operating companies in numbers, 2019
| № | Indicator | Value | Share | |
| I | Legal form | Profit-making companies, including: | 3 243 thousand | 84% |
| Limited liability companies (LLC) | 3 143 thousand | 97% | ||
| Joint-stock companies (JSC) | 67 thousand | 2% | ||
| Other profit-making companies | 33 thousand | 1% | ||
| Non-profit organizations: | 622 thousand | 16% | ||
| Institutions | 219 thousand | 35% | ||
| Partnerships | 106 thousand | 17% | ||
| Other non-profit organizations | 297 thousand | 48% | ||
| II | Status | Active | 3 576 thousand | 92% |
| In process of reorganization | 10 thousand | <1% | ||
| In process of reorganization with subsequent liquidation | 13 thousand | <1% | ||
| In process of being wound up | 294 thousand | 8% | ||
| III | Region of registration | Moscow | 726 thousand | 19% |
| Saint Petersburg | 298 thousand | 8% | ||
| Moscow region | 201 thousand | 5% | ||
| Other subjects | 2 640 thousand | 68% | ||
| IV | Age | Up to 1 year | 313 thousand | 8% |
| From 1 to 3 years | 664 thousand | 17% | ||
| Up to 5 years | 566 thousand | 15% | ||
| Over 5 years | 2 352 thousand | 60% | ||
| V | Country of a shareholder-legal entity with a share exceeding 50% | Russia | 151 thousand | 85% |
| Cyprus | 8 thousand | 4% | ||
| Seychelles | 2 thousand | 1% | ||
| Other countries | 17 thousand | 10% | ||
| VI | Country of a shareholder-natural person with a share exceeding 50% | Russia | 2 414 thousand | 97% |
| Other countries | 86 thousand | 3% | ||
| VII | Category of operating companies, on July 2019 | Medium-sized enterprises | 18 thousand | 1% |
| Small enterprises | 217 thousand | 6% | ||
| Micro-enterprises | 2 529 thousand | 65% | ||
| Others | 1 101 thousand | 28% | ||
| VIII | Turnover by category of companies, 2018 | Major taxpayers | 127 trillion RUB | 68% |
| Medium-sized enterprises | 7 trillion RUB | 4% | ||
| Small enterprises | 29 trillion RUB | 15% | ||
| Micro-enterprises | 24 trillion RUB | 13% | ||
| IX | Increase (decrease) in turnover in 2018 compared to 2017 | Major taxpayers | +27% | - |
| Medium-sized enterprises | +6% | - | ||
| Small enterprises | +7% | - | ||
| Micro-enterprises | +14% | - | ||
| X | Financial result for 2018 | Share of profitable companies | 73% | - |
| Share of loss-making companies | 27% | - | ||
| XI | Receipt of taxes to the consolidated budget of Russia, 2018 | Mining | 7,8 trillion RUB | 37% |
| Manufacturing | 3,5 trillion RUB | 16% | ||
| Wholesale and retail trade | 2,1 trillion RUB | 10% | ||
| Other activities | 7,7 trillion RUB | 37% | ||
| XII | Solvency index Globas of active companies | Superior/High | 56 thousand | 2% |
| Strong/Medium | 830 thousand | 24% | ||
| Adequate/Weak | 1 174 thousand | 34% | ||
| Unsatisfactory/Poor | 1 074 thousand | 31% | ||
| Insufficient | 333 thousand | 9% |
Summary
One of the main risks of business in Russia is the forced exit to the shadow economy. High taxes and low profit margins force companies to artificially lower financial figures, use gray schemes, and attract shell companies.
Russian business, especially new established companies, suffer from a shortage of capital. Almost all profits go into turnover, which makes it impossible to expand. Loans are the only solution in this case, but interest rates for business are high, and loans are not available for start-ups.
An acute shortage of financing causes business instability. Lack of funds, competition, external negative factors can lead to losses and, ultimately, to the company's withdrawal from the market.
The undoubted advantage of Russian companies is their flexibility and adaptability. Domestic entrepreneurs quickly adapt to the external environment, which is obviously a positive effect from political and economic instability.
Light colors to the portrait are added by the idea of national projects that can stimulate economic growth and improve financial performance. The ambitious budget of national projects for 2019-2024 at total value of 25,7 trillion RUB will lead to a direct effect in the form of annual increase in GDP growth by 0,2% and up to 0,1% indirectly. At the same time, 60% of the expenditures are planned for updating the infrastructure.
In addition, there is hope for improvement in the investment climate due to the reduced threat of new sanctions, as well as strengthening of the ruble.