
Order a report
Custom-made industry research, company ratings, competitor analysis


Trends in service sector in time of crisis
Information agency Credinform has prepared a review of activity trends of the largest Russian companies of the service sector during the financial crisis of 2008-2009.
The largest service sector companies (washing and dry cleaning of fabric and fur products, hair and beauty salons, funeral services, activities of bath houses and saunas, wellness centers and fitness clubs, social services, pet care, etc.) (ТОP-1000) in terms of annual revenue were selected according to the data from the Statistical Register for the latest available periods (2006 - 2011). The analysis was based on data of the Information and Analytical system Globas.
Number of active companies
Within 2006 - 2011 the number of active companies was growing, however in time of crisis and in the beginning of recovery, the growth rate was decreasing.
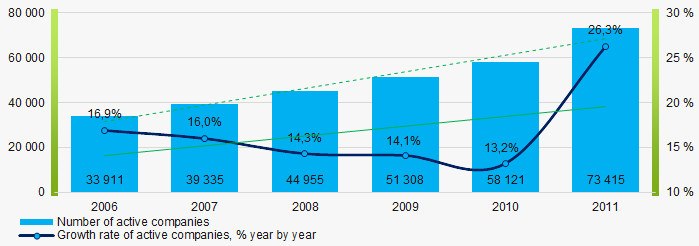 Picture 1. Dynamics of active companies in 2006 – 2011
Net assets is a ratio reflecting the real value of company's property. It is calculated annually as the difference between assets on the enterprise balance and its debt obligations. The ratio is considered negative (insufficiency of property), if company’s debt exceeds the value of its property.
The largest company in terms of net assets was JSC LUZHNIKI OLYMPIC COMPLEX, INN 7704077210, Moscow, health and fitness activity. In 2011 net assets of the company amounted to almost 8 billion RUB. In 2018 the indicator amounted to almost 44 billion RUB.
The smallest size of net assets in TOP-1000 had LLC AKVASTAR, INN 1101032480, Komi Republic, washing and dry cleaning of fabric and fur products. The lack of property of the company in 2011 was expressed in negative terms -28 million RUB and in 2018 -2 million RUB.
Within 2006-2011, the average values of TOP-1000 net assets showed the growing tendency, however the growth rate was decreasing (Picture 2).
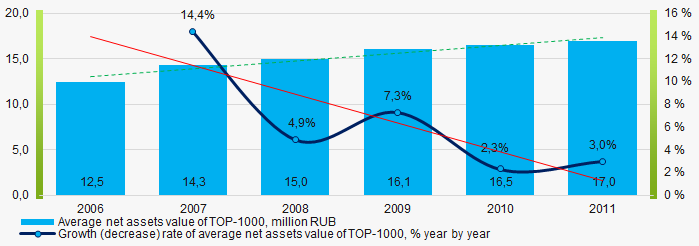 Picture 2. Change in average net assets value of ТОP-1000 companies in 2006– 2011
Within 2006 - 2011, the share of ТОP-1000 enterprises with lack of property is decreasing (Picture 3).
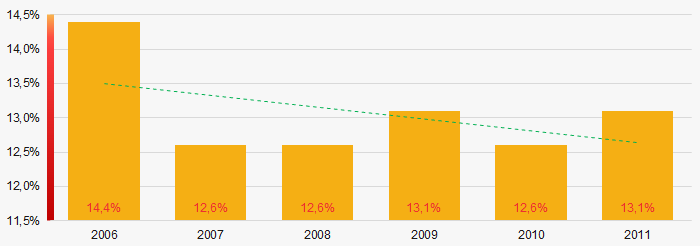 Picture 3. The share of enterprises with negative net assets value in ТОP-1000 in 2006 – 2011
 Sales revenue
The largest company by sales revenue was also JSC LUZHNIKI OLYMPIC COMPLEX, INN 7704077210, Moscow, health and fitness activity. In 2011 the indicator amounted to more than 2 billion RUB and in 2018 just over 1 billion RUB. In general, the growing trend in sales revenue with decreasing growth rate was observed (Picture 4).
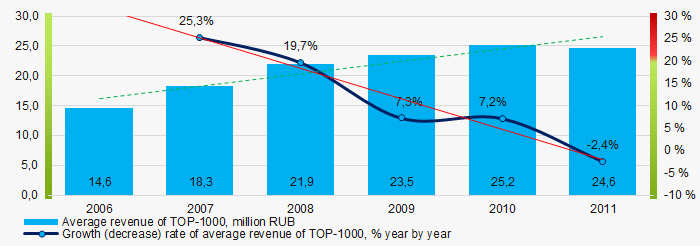 Picture 4. Change in average revenue of TOP-1000 in 2006 – 2011
Profit and loss
The largest company in terms of net profit was LLC LINDSTROM, INN 7816659619, St. Petersburg, washing and dry cleaning of fabric and fur products. In 2011 the company’s profit amounted to 100 million RUB and in 2018 – 113 million RUB.
Within 2006 – 2011, the average profit values of TOP-1000 showed the decreasing tendency (Picture 5).
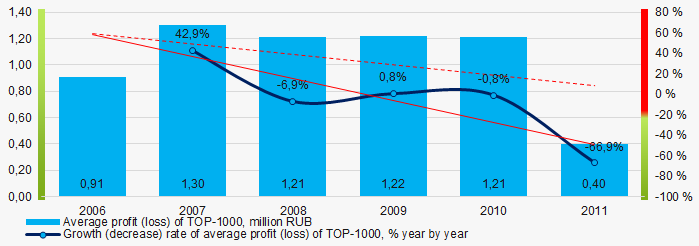 Picture 5. Change in average profit (loss) of TOP-1000 in 2006 – 2011
 In 2006 – 2011 the average net profit values of ТОP-1000 showed the growing tendency, along with this the average net loss was increasing (Picture 6).
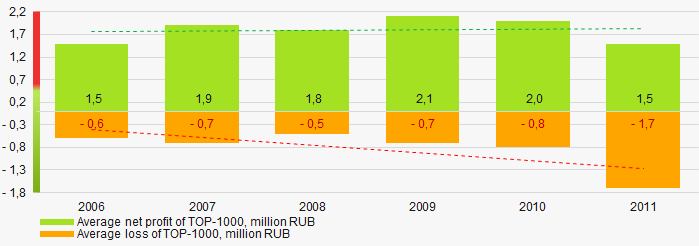 Picture 6. Change in average net profit/loss of ТОP-1000 in 2006 – 2011
 Main financial ratios
In 2006 – 2011 the average values of the current liquidity ratio were higher than the recommended values - from 1,0 to 2,0, with growing trend (Picture 7).
The current liquidity ratio (ratio of total working capital to short-term liabilities) shows the sufficiency of company’s assets to meet short-term obligations.
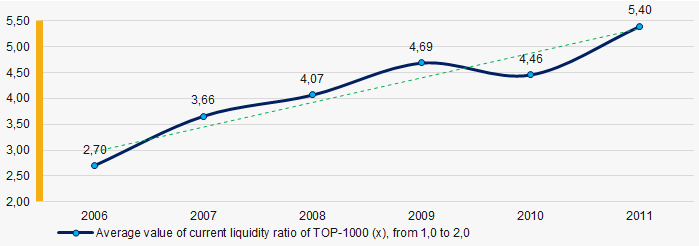 Picture 7. Change in average values of current liquidity ratio of TOP-1000 companies in 2006 – 2011
 Within 2006 - 2011 the growing trend of the average values of ROI ratio with downward trend in the crisis 2009 was observed (Picture 8).
The ROI ratio is calculated as a ratio of net profit to sum of stockholder equity and long-term liabilities and shows the return from equity involved in commercial activities and long-term borrowed funds.
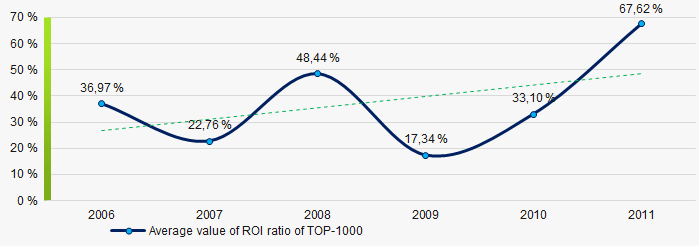 Picture 8. Change in average values of ROI ratio in 2006 – 2011
Assets turnover ratio is the ratio of sales revenue and company’s average total assets for a period. It characterizes the effectiveness of using of all available resources, regardless the source of their attraction. The ratio shows how many times per year the full cycle of production and circulation is performed, generating the corresponding effect in the form of profit.
n 2006 – 2011 this business activity ratio demonstrated the growing trend (Picture 9).
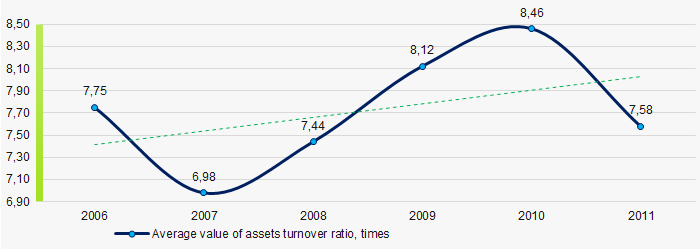 Picture 9. Change in average values of assets turnover ratio of TOP-1000 companies in 2006 – 2011
 Small businesses
64% of ТОP-1000 companies are registered in the Unified register of small and medium-sized enterprises of the Russian Federal Tax Service. Herein, in 2011 their share in TOP-1000 total revenue was almost 36% (Picture 10).
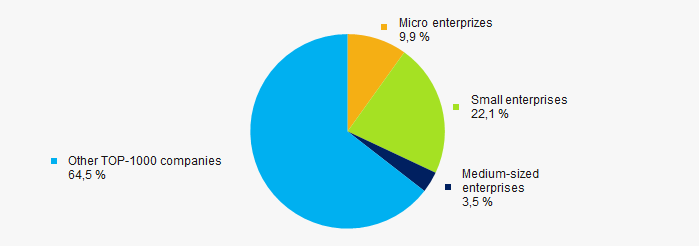 Picture 10. Revenue of small and medium-sized enterprises in 2011
 Main regions of activity
ТОP-1000 companies are unequally located across the country and registered in 77 regions of Russia. Almost 48% of the largest enterprises in terms of revenue are located in Moscow, Moscow region and St. Petersburg (Picture 11).
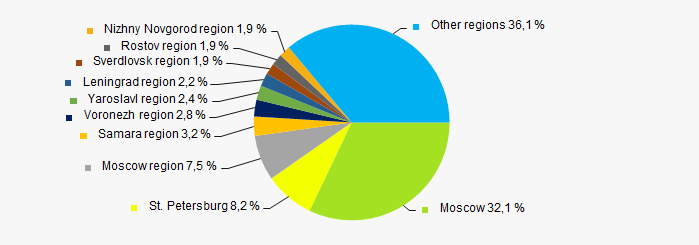 Picture 11. Distribution of TOP-1000 revenue by regions of Russia in 2011
Financial position score
An assessment of the financial position of TOP-1000 companies shows that in 2020 the largest part have the average financial position (Picture 12).
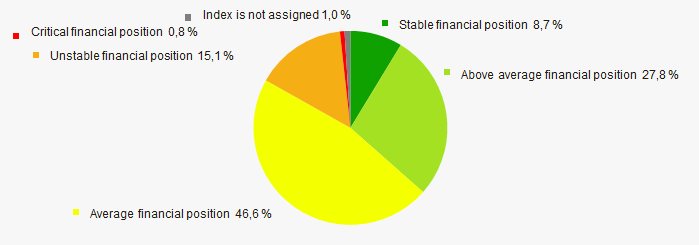 Picture 12. Distribution of TOP-1000 companies by financial position score in 2020
Solvency index Globas
In 2020 the most of TOP-1000 companies got superior/high or strong/medium Solvency index Globas, this fact shows the ability of the companies to meet their obligations in time and fully (Picture 13).
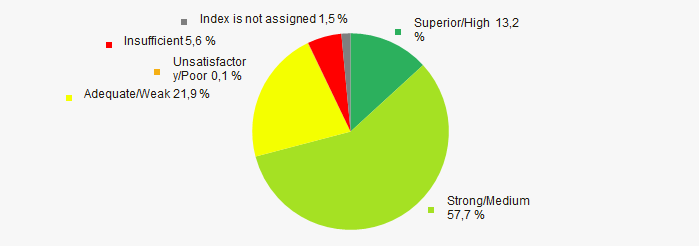 Picture 13. . Distribution of TOP-1000 companies by Solvency index Globas in 2020
 Conclusion
A complex assessment of activity of the largest Russian companies of the service sector, taking into account the main indexes, financial ratios and indicators, demonstrates the presence of positive trends within 2006-2011 (Table 1).
| Trends and assessment factors | Relative share, % | Possible forecast |
| Dynamics of active companies | |
|
| Growth rate of active companies | |
During the acute phase of crisis the number of active companies may decrease. |
| Dynamics of average net assets value | |
|
| Growth/drawdown rate of average net assets value | |
During the crisis recovery the growth rate of average net assets may decrease |
| Increase / decrease in the share of enterprises with negative net assets | |
During the acute phase of crisis number of enterprises with negative net assets may increase |
| Dynamics of average revenue | |
|
| Growth/drawdown rate of average revenue | |
In time of crisis the growth rate of revenue may decrease |
| Dynamics of average profit | |
In time of crisis and its recovery the profit may decrease |
| Growth/drawdown rate of average net profit (loss) | |
|
| Increase / decrease in average net profit of companies | |
|
| Increase / decrease in average net loss of companies | |
In time of crisis and its recovery the net loss may increase |
| Increase / decrease in average values of current liquidity ratio | |
|
| Increase / decrease in average values of ROI ratio | |
During the acute phase of crisis the ROI ratio may decrease |
| Increase / decrease in average values of assets turnover ratio, times | |
|
| Share of small and medium-sized businesses by revenue more than 20% | |
|
| Regional concentration | |
|
| Financial position (the largest share) | |
|
| Solvency index Globas (the largest share) | |
|
| Average value of factors | |
![]() favorable trend (factor),
favorable trend (factor), ![]() unfavorable trend (factor).
unfavorable trend (factor).