
Order a report
Custom-made industry research, company ratings, competitor analysis


TOP 10 wood processing enterprises
Information agency Credinform presents the ranking of the largest Russian primary wood processing enterprises. The largest companies in the industry (TOP 10 and TOP 1000) in terms of annual revenue for the last reporting periods available in the state statistics bodies and the Federal Tax Service (2018-2020) were selected for the ranking. Then they were ranked by product profitability ratio (Table 1). Selection of companies and analysis were carried out on the basis of data from the Information and Analytical system Globas.
Product profitability is calculated as a ratio of profit from sales to ordinary activities expenses. In general, profitability reflects the economic efficiency of production. Analysis of product profitability allows us to assess efficiency and feasibility of manufacturing goods.
There are no standard values for indicators of this group, since they vary greatly depending on industry.
It is necessary to pay attention to the entire set of indicators and financial ratios to get the most complete and objective picture of enterprise's financial condition.
| Name, INN, region | Revenue, million rubles | Net profit (loss), million rubles. | Product profitability, % | Globas Solvency Index | |||
| 2019 | 2020 | 2019 | 2020 | 2019 | 2020 | ||
| 1 | 2 | 3 | 4 | 5 | 6 | 7 | 8 |
| MAYER-MELNHOF HOLZ EFIMOVSKY LLC INN 4715778325 Leningrad Region |
|
|
|
|
|
|
192 Superior |
| KALEVALA WOODWORKING PLANT LLC INN 7807311832 Republic of Karelia |
|
|
|
|
|
|
229 Strong |
| LESRESURS LLC INN 3808156861 Irkutsk Region |
|
|
|
|
|
|
168 Superior |
| ILIM TIMBER INDUSTRY LLC INN 7838407799 Saint Petersburg |
|
|
|
|
|
|
191 Superior |
| LESOZAVOD 25 JSC INN 2928001265 Arkhangelsk Region |
|
|
|
|
|
|
171 Superior |
| YUGORSKY TIMBER INDUSTRY HOLDING LLC INN 8601022074 Khanty-Mansi Autonomous Area - Yugra |
|
|
|
|
|
|
149 Superior |
| ULK GROUP OF COMPANIES LLC INN 2922008546 Arkhangelsk Region |
|
|
|
|
|
|
321 Adequate |
| LESOSIBIRSKY LDK №1 JSC INN 2454003302 Krasnoyarsk Territory |
|
|
|
|
|
|
281 Medium |
| AMUR TIMBER INDUSTRY COMPANY LLC INN 2721162072 Khabarovsk Territory |
|
|
|
|
|
|
321 Adequate |
| RUSSIAN FOREST 3000 LLC INN 6711012340 Smolensk Region |
|
|
|
|
|
|
275 Medium |
| TOP 10 average value | |
|
|
|
|
|
|
| TOP 1000 average value | |
|
|
|
|
|
|
| Industry average value | |
|
|
|
|
|
|
![]() improvement of the indicator to the previous period,
improvement of the indicator to the previous period, ![]() deterioration of the indicator to the previous period
deterioration of the indicator to the previous period
In 2020, average indicators of the product profitability coefficient of the TOP 10 and TOP 1000 are higher than the industry average. Two companies from the TOP 10 had negative indicators in both 2019 and 2020. The decline in indicators in 2020 was observed in three TOP 10 companies, while in 2019 there were six such companies.
At the same time, in 2020, seven companies increased their revenue and five companies increased their net profit.
The increase in average revenue in the TOP 10 amounted to 2%, in the TOP 1000 - 4%, and the average industry indicator decreased by almost 1%.
The average profit in the TOP 10 decreased by almost 4 times, in the TOP 1000 - by 30 times, and the average drop in the industry was 25 times.
Over the past 5 years, average industry indicators of product profitability coefficient have been growing only in 2018. The best value of indicator was achieved in the same year, and the worst result was shown in 2017. (Picture 1).
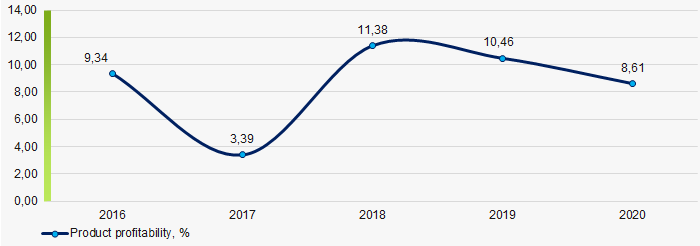 Picture 1. Changes in average industry values of product profitability coefficient of primary wood processing enterprises in 2016-2020.