
Order a report
Custom-made industry research, company ratings, competitor analysis


Return on assets of the largest hotels
Information agency Credinform represents the ranking of the largest Russian hotel business enterprises. The companies with the largest volume of annual revenue (TOP-10) were selected for the ranking, according to the data from the Statistical Register for the latest available periods (for 2015 - 2017). Then they were ranked by accounts receivable turnover (Table 1). The analysis was made on the basis of the data of the Information and Analytical system Globas.
Return on assets (%) is calculated as the relation of the sum of net profit and interest payable to the total assets value of a company and shows how many monetary units of net profit are earned by every unit of total assets.
The ratio characterizes the effectiveness of using by the company of its resources. The higher is the ratio value, the more effective is business, that is the higher the return per every monetary unit invested in assets.
However, it is necessary to take into account that the book value of assets may not correspond to their current market value. For example, under the influence of inflation, the book value of fixed assets will increasingly be underestimated in time, that will lead to an overestimation of the return on assets. Thus, it is necessary to take into account not only the structure, but also the age of the assets.
It should be also taken into account the dynamics of this indicator. Its consistent decline indicates a drop in asset utilization.
The experts of the Information agency Credinform, taking into account the actual situation both in the economy as a whole and in the sectors, has developed and implemented in the Information and Analytical system Globas the calculation of practical values of financial ratios that can be recognized as normal for a particular industry. For hotel business enterprises the practical value of the return on assets ratio is from -9,3%.
For getting of the most comprehensive and fair picture of the financial standing of an enterprise it is necessary to pay attention to all combination of indicators and financial ratios.
| Name of legal entity and hotel, INN, region | Revenue, billion RUB | Net profit (loss), billion RUB | Retune on assets, % | Solvency index Globas | |||
| 2016 | 2017 | 2016 | 2017 | 2016 | 2017 | ||
| 1 | 2 | 3 | 4 | 5 | 6 | 7 | 8 |
| SOKOTEL LLC Solo Sokos Hotel Palace Bridge INN 7841338200 Saint-Petersburg |
|
|
|
|
|
|
175 High |
| LOTTE RUS NJSC Lotte Hotel Moscow INN 7704169180 Moscow |
|
|
|
|
|
|
238 Strong |
| EUROPE HOTEL LLC Grand Hotel Europe INN 7841304521 Saint-Petersburg |
|
|
|
|
|
|
165 Superior |
| TURISTSKIE GOSTINICHNYE KOMPLEKSY IZMAILOVO NJSC Izmailovo Hotel INN 7719017101 Moscow |
|
|
|
|
|
|
158 Superior |
| FORSE LLC Four Seasons Hotel Moscow INN 7703774970 Moscow |
|
|
|
|
|
|
247 Strong |
| VYSOTKA LLC Hotel Radisson Collection Moscow INN 7730121138 Moscow |
|
|
|
|
|
|
251 Medium |
| KRASNAYA POLYANA NJSC Resort Gorky Gorod INN 2320102816 Krasnodar territory |
|
|
|
|
|
|
275 Medium |
| SKI RESORT DEVELOPMENT COMPANY ROSA KHUTOR LLC Ski resort Rosa Khutor INN 7702347870 Moscow |
|
|
|
|
|
|
267 Medium |
| TALEON PJSC Taleon Imperial Hotel INN 7808025538 Saint-Petersburg |
|
|
|
|
|
|
257 Medium |
| MANAGEMENT COMPANY OKHOTNY RYAD LLC Metropol Hotel INN 7704833523 Moscow |
|
|
|
|
|
|
291 Medium |
| Total by TOP-10 companies | |
|
|
|
|||
| Avearge value by TOP-10 companies | |
|
|
|
|
|
|
| Industry average value | |
|
|
|
|
|
|
![]() — improvement of the indicator to the previous period,
— improvement of the indicator to the previous period, ![]() — decline in the indicator to the previous period.
— decline in the indicator to the previous period.
The average value of the return on sales of TOP-10 enterprises is above industry average and practical values. Six companies from the TOP-10 list improved the indicators in 2017 compared to the previous period.
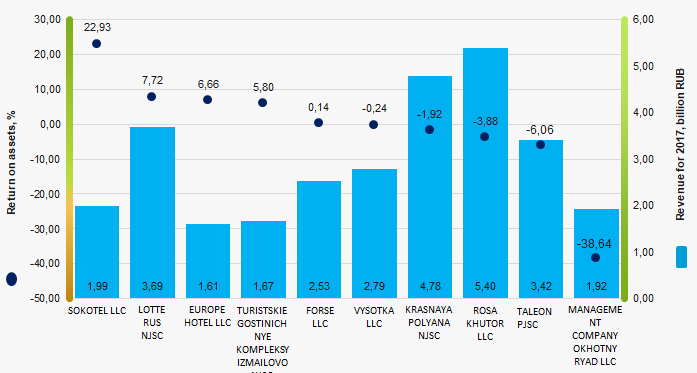 Picture 1.Return on assets and revenue of the largest Russian hotel business enterprises (TOP-10)
The industry average indicators of the return on assets ratio have a downward trend over the course of 10 years (Picture 2).
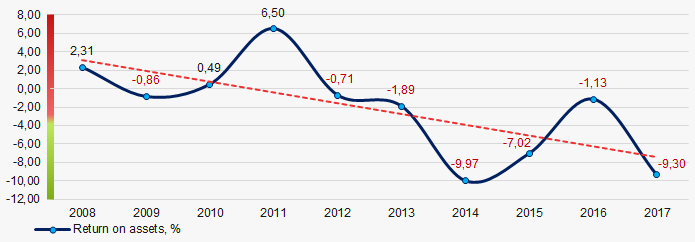 Picture 2. Change in the industry average values of the return on assets of Russian hotel business enterprises in 2008 – 2017