
Order a report
Custom-made industry research, company ratings, competitor analysis


Trends in activity of companies of Volgograd region
Information agency Credinform has prepared a review of activity trends of the largest companies of real economy sector in Volgograd region. The largest companies of Volgograd region (ТОP-1000) in terms of annual revenue were selected according to the data from the Statistical Register for the latest available periods (2013 - 2017). The analysis was based on data of the Information and Analytical system Globas.
Net assets is a ratio reflecting the real value of company's property. It is calculated annually as the difference between assets on the enterprise balance and its debt obligations. The ratio is considered negative (insufficiency of property), if company’s debt exceeds the value of its property.
| № | Name, INN, activity | Net assets value, bln RUB | Solvency index Globas | ||||
| 2013 | 2014 | 2015 | 2016 | 2017 | |||
| 1 | LLC LUKOIL-VOLGOGRADNEFTEPERERABOTKA INN 3448017919 Manufacture of refined petroleum products |
|
|
|
|
|
179 High |
| 2 | LLC Imperial Tobacco Volga INN 3443033593 Manufacture of tobacco products |
|
|
|
|
|
221 Strong |
| 3 | NAO SEBRYKOVCEMENT INN 3437000021 Manufacture of cement |
|
|
|
|
|
166 Superior |
| 4 | NAO Volzhsky Orgsynthese INN 3435900563 Manufacture of other inorganic basic chemicals |
|
|
|
|
|
194 High |
| 5 | NAO KAUSTIK INN 3448003962 Manufacture of other inorganic basic chemicals |
|
|
|
|
|
168 Superior |
| 996 | MUPP VMES INN 3441010181 Distribution of electricity Process of being wound up, 11.07.2014 |
|
|
|
|
|
600 Insufficient |
| 997 | LLC INVESTMENT COMPANY CITYCENTRE INN 3445091343 Real estate management on a fee or contract basis |
|
|
|
|
|
262 Medium |
| 998 | LLC VOLGAINVEST INN 5905238577 Investment in authorized capital, venture capital investment, including through the investment companies Process of being wound up, 03.06.2016 |
|
|
|
|
|
600 Insufficient |
| 999 | PUBLIC CORPORATION DPK INN 3305056518 Other financial service activities, except insurance and pension funding |
|
|
|
|
|
328 Adequate |
| 1000 | JSC VOLGOGRADENERGOSALE INN 3445071523 Trade with electricity |
|
|
|
|
|
223 Strong |
![]() — growth indicator in comparison with prior period,
— growth indicator in comparison with prior period, ![]() — decline indicator in comparison with prior period.
— decline indicator in comparison with prior period.
For the last five years, the average values of TOP-1000 net assets showed the growing tendency (Picture 1).
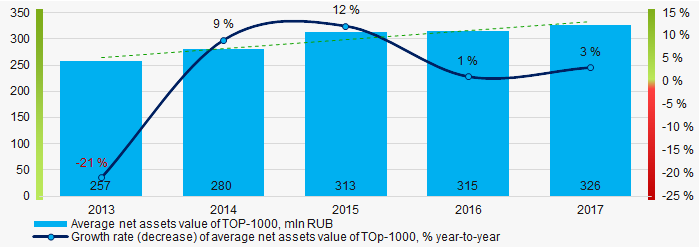 Picture 1. Change in average net assets value of ТОP-1000 companies in 2013 – 2017
 For the last five years, the share of ТОP-1000 enterprises with lack of property is growing (Picture 2).
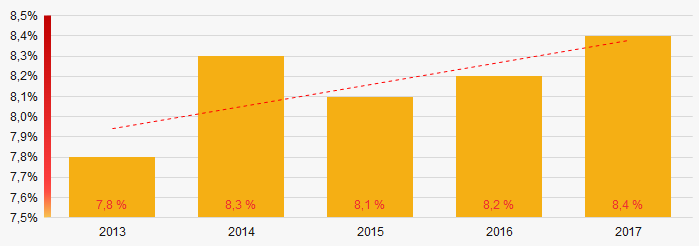 Picture 2. The share of enterprises with negative net assets value in ТОP-1000
Sales revenue
In 2017, the total revenue of 10 largest companies amounted to 60% from ТОP-1000 total revenue (Picture 3). This fact testifies high level of capital concentration in Volgograd region.
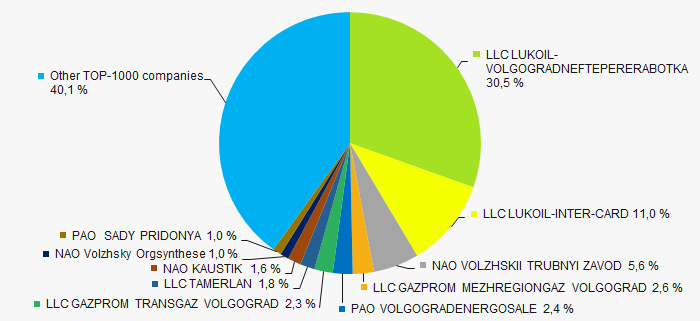 Picture 3. Shares of TOP-10 in TOP-1000 total revenue for 2017
In general, the decrease in average sales revenue is observed (Picture 4).
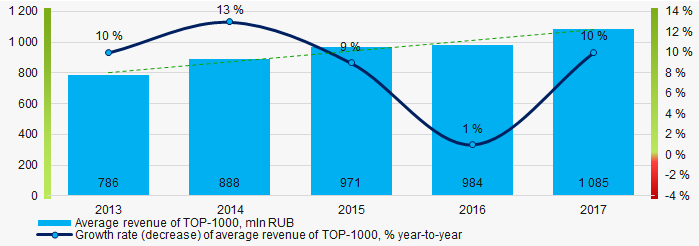 Picture 4. Change in average revenue of TOP-1000 in 2013 – 2017
Profit and loss
In 2017 profit of 10 largest companies amounted to 59% from TOP-1000 total profit (Picture 5).
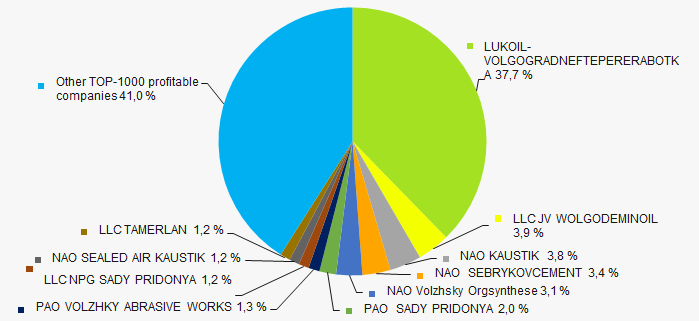 Picture 5. Shares of TOP-10 companies in TOP-1000 total profit for 2017
For the last five years, the average profit values of TOP-1000 show the decreasing tendency (Picture 6).
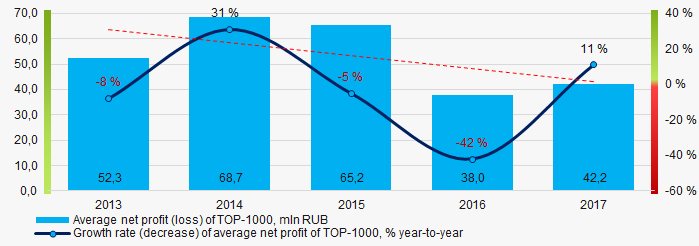 Picture 6. Change in average profit of TOP-1000 in 2013 – 2017
Over a five-year period, the average net profit values of ТОP-1000 show the decreasing tendency, along with this the average net loss is growing (Picture 7).
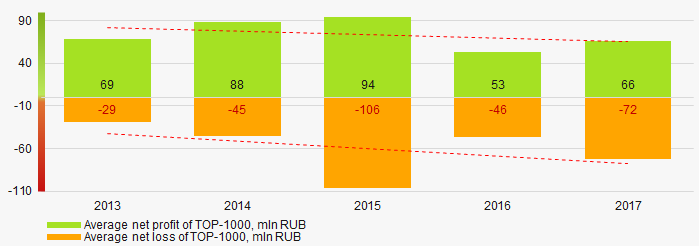 Picture 7. Change in average net profit/loss of ТОP-1000 companies in 2013 – 2017
 Main financial ratios
For the last five years, the average values of the current liquidity ratio were significantly higher than the recommended values - from 1,0 to 2,0, with growing tendency (Picture 8).
The current liquidity ratio (ratio of total working capital to short-term liabilities) shows the sufficiency of company’s assets to meet short-term obligations.
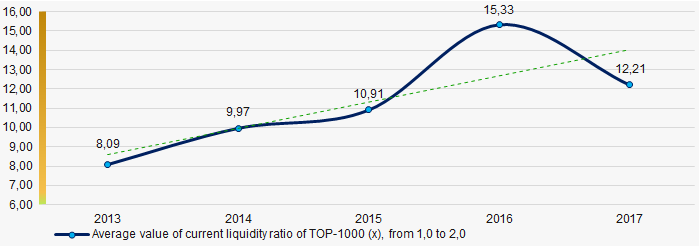 Picture 8. Change in average values of current liquidity ratio of TOP-1000 companies in 2013 – 2017
For the last five years, especially in 2013-2014, the high level of the average values of ROI ratio with decreasing tendency is observed (Picture 9).
The ROI ratio is calculated as a ratio of net profit to sum of stockholder equity and long-term liabilities and shows the return from equity involved in commercial activities and long-term borrowed funds.
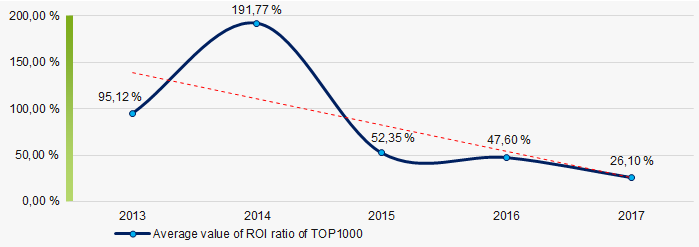 Picture 9. Change in average values of ROI ratio in 2013 – 2017
Assets turnover ratio is the ratio of sales revenue and company’s average total assets for a period. It characterizes the effectiveness of using of all available resources, regardless the source of their attraction. The ratio shows how many times per year the full cycle of production and circulation is performed, generating the corresponding effect in the form of profit.
For the last five years, this business activity ratio demonstrated the downward trend (Picture 10).
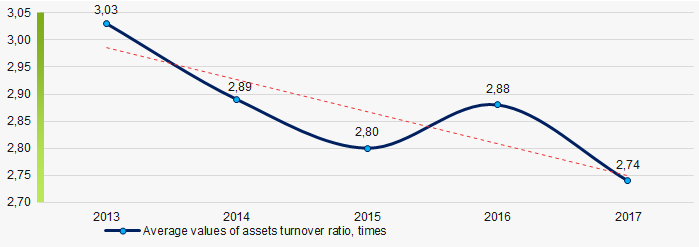 Picture 10. Change in average values of assets turnover ratio of TOP-1000 companies in 2013 – 2017
Production structure
he largest share of ТОP-1000 total revenue is occupied by the enterprises engaged in manufacture of refined petroleum products and wholesale companies (Picture 11).
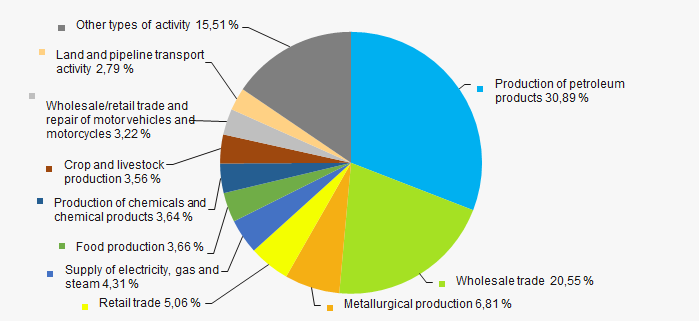 Picture 11. Distribution of activities in ТОP-1000 total revenue
77% of ТОP-1000 companies are registered in the Unified register of small and medium-sized enterprises of the Russian Federal Tax Service. Herein, their share in TOP-1000 total revenue amounted to 16,5% (Picture 12).
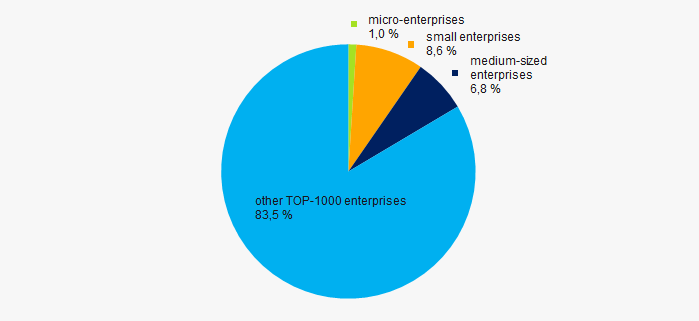 Picture 12. Shares of small and medium-sized enterprises in ТОP-1000
Main regions of activity
ТОP-1000 companies are unequally located across the country and registered in 35 regions of Russia. 89% of the largest enterprises in terms of revenue are located in Volgograd and Volzhsk (Picture 13).
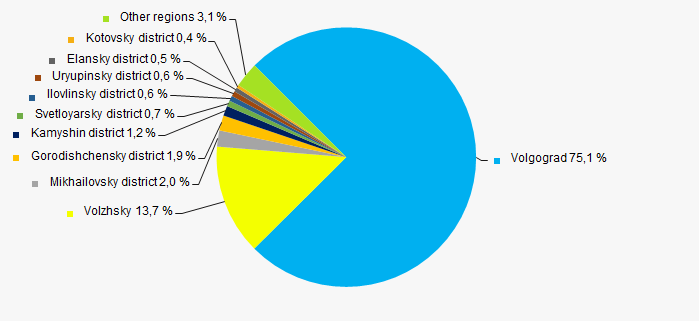 Picture 13. Distribution of TOP-1000 revenue by the districts of Volgograd region
Financial position score
An assessment of the financial position of TOP-1000 companies shows that more than a half of them have stable or above average financial position (Picture 14).
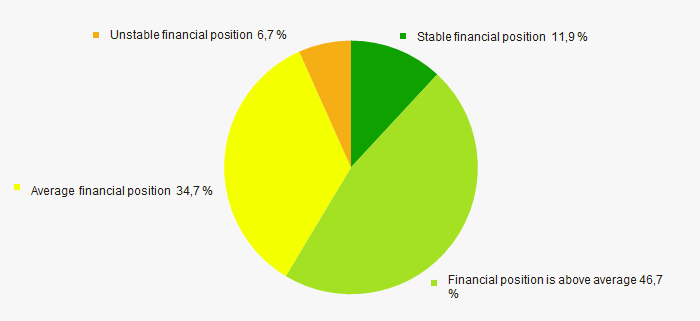 Picture 14. Distribution of TOP-1000 companies by financial position score
Solvency index Globas
Most of TOP-1000 companies got superior/high or strong/medium Solvency index Globas, this fact shows the ability of the companies to meet their obligations in time and fully (Picture 15).
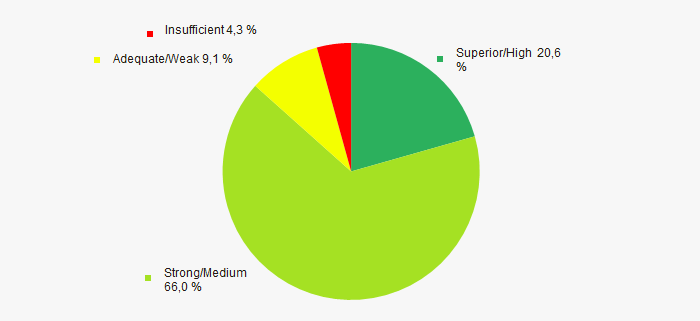 Picture 15. Distribution of TOP-1000 companies by Solvency index Globas
Industrial production index
According to the Federal Service of State Statistics, there is a downward trend in the industrial production index in Volgograd region during 12 months of 2017 – 2018. For 11 months of 2018, the index decreased by an average of 0,7%, and in general, from November 2017 to October 2018, the average growth by 1.6% is observed (Picture 16).
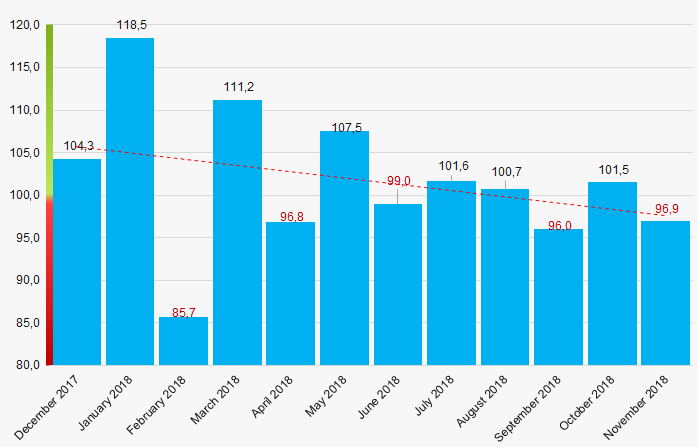 Picture 16. Industrial production index in Volgograd region in 2017 - 2018, month by month (%)
According to the same data, the share of enterprises of Volgograd region in the amount of revenue from the sale of goods, works, services made 0,73% countrywide for 9 months of 2018.
Conclusion
A complex assessment of activity of the largest companies of Volgograd region real economy, taking into account the main indexes, financial ratios and indicators, demonstrates the presence of negative trends (Table 2).
| Trends and assessment factors | Relative share, % |
| Growth/drawdown rate of average net assets value | |
| Increase / decrease in the share of enterprises with negative net assets | |
| The level of capital concentration | |
| Growth/drawdown rate of average revenue | |
| Growth/drawdown rate of average net profit (loss) | |
| Increase / decrease in average net profit of companies | |
| Increase / decrease in average net loss of companies | |
| Increase / decrease in average values of current liquidity ratio | |
| Increase / decrease in average values of ROI ratio | |
| Increase / decrease in average values of assets turnover ratio, times | |
| Share of small and medium-sized businesses by revenue more than 30% | |
| Regional concentration | |
| Financial position (the largest share) | |
| Solvency index Globas (the largest share) | |
| Industrial production index | |
| Average value of factors | |
![]() — favorable trend (factor),
— favorable trend (factor), ![]() — unfavorable trend (factor).
— unfavorable trend (factor).