Ranking
Return on assets of the largest Russian enterprises for passenger transportation

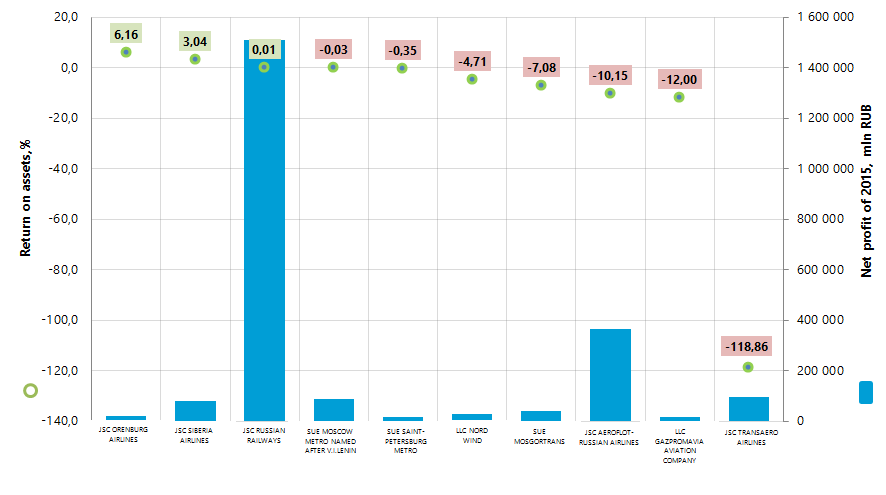
Information agency Credinform has prepared a ranking of the largest Russian enterprises for passenger transportation. The TOP-10 companies with the highest volume of revenue were selected for the ranking, according to the data from the Statistical Register for the latest available accounting periods (2015 and 2014). Enterprises of the rating are ranked by return on assets (Table 1).

Return on assets ratio (%) is calculated as the relation of the sum of net profit and interest payable to the total assets value and shows how many monetary units of net profit gets every unit of total assets. The ratio characterizes the effectiveness of using of all available resources and financial management. The higher is the ratio value, the more effective is business, that is higher return per every invested in assets monetary unit.

However, it should be considered that book value of assets cannot correspond to its current market price to a great extent. For example, under inflation the book value of fixed assets with a course of time will be more and more underestimated, that leads to overestimation of return on assets. In other words, it is necessary to pay attention not only to the assets structure but also to its maturity.

Dynamics of this indicator also should be considered. The subsequent decrease demonstrates decline of effectiveness in the assets use.

Table 1. Net profit, revenue, return on assets, solvency index Globas-i® of the largest Russian enterprises for passenger transportation (TOP-10)
NameNet profit (loss) of 2015, mln RUBRevenue of 2015, mln RUBRevenue of 2015 to 2014, +/- %Return on assets, %Solvency index Globas-i®
JSC ORENBURG AIRLINES
INN 5638057840 Orenburg region
506,4 22 765,9 17 6,16 282
High
JSC SIBERIA AIRLINES
INN 5448100656 Novosibirsk region
922,9 82 214,5 16 3,04 282
Highest
JSC RUSSIAN RAILWAYS
INN 7708503727 Moscow
318,0 1 510 757,0 8 0,01 227
High
SUE MOSCOW METRO NAMED AFTER V.I.LENIN
INN 7702038150 Moscow
-505,2 87 471,0 4 -0,03 249
High
SUE SAINT-PETERSBURG METRO
INN 7830000970 Saint-Petersburg
-270,1 18 831,6 8 -0,35 234
High
LLC NORD WIND
INN 7733646084 Moscow
-270,8 26 867,4 -34 -4,71 309
Satisfactory
SUE MOSGORTRANS
INN 7705002602 Moscow
-5 577,6 41 534,2 3 -7,08 247
High
JSC AEROFLOT-RUSSIAN AIRLINES
INN 7712040126 г. Москва
-18 927,8 366 307,5 52 -10,15 176
Highest
LLC GAZPROMAVIA AVIATION COMPANY
INN 7736046504 Moscow
-4 652,5 16 164,8 2 -12,00 258
High
JSC TRANSAERO AIRLINES
INN 5701000985 Saint-Petersburg
-98 932,7 97 711,1 -17 -118,86 450
Low
Total for TOP-10 companies
(* - average value for the group)
-127 389,6 2 270 625,0 *11 *-14.40  
Total for TOP-100 companies
(*- average value for the group)
-128 780,6 2 447 090,6 *12 *-4,97  

Average values of return on assets in 2015 are negative both in the TOP-10 and in the TOP-100 groups.

Industry average values of return on assets are shown in the Table 2.

Table 2. Industry average values of return on assets in terms of passenger transport types
Type of passenger transport201320142015
Maritime -2,49 -7,15 3,96
Railway in suburban traffic н/д 0,23 1,14
Railway backbone 0,55 -0,71 0,33
Underground н/д 0,21 -0,12
Taxi -10,38 34,05 -0,30
Inland water 6,77 -3,96 -6,39
Bus -4,62 -5,91 -6,99
Tramway -1,86 -14,15 -8,96
Trolley bus -6,55 -4,03 -15,36
Air -3,12 -12,10 -31,02

Only three companies out of TOP-10 have got positive values of return on assets.

Return on assets and revenue of the largest Russian enterprises for passenger transportations (TOP-10)
Picture 1. Return on assets and revenue of the largest Russian enterprises for passenger transportations (TOP-10)

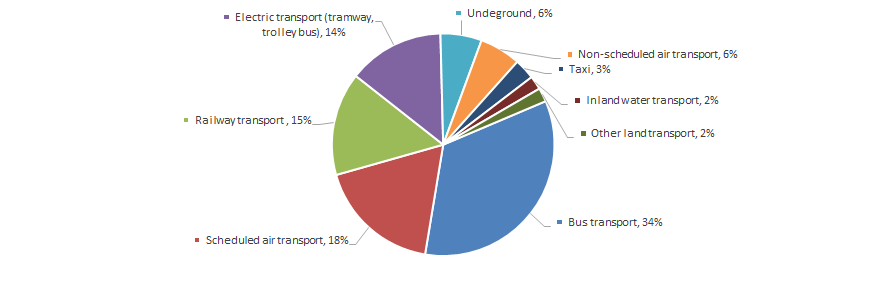
Revenue volume of the 10 largest companies is 93% of total revenue of the 100 largest companies. It shows high level of monopolization, first of all, in the area of railway passenger transportations, because share of the largest company, according to the revenue volume in 2015 - JSC RUSSIAN RAILWAYS is almost 67% of total revenue of the TOP-10 group. Besides, enterprises for bus passenger transportations have got the biggest share in the total revenue of TOP-100 companies (Picture 2).

Share of TOP-100 companies` total revenue in 2015 in terms of passenger transportation type, %
Picture 2. Share of TOP-100 companies` total revenue in 2015 in terms of passenger transportation type, %

Eight out of TOP-10 companies have got the highest or high solvency index Globas-i®, that demonstrates the ability to pay the debts in time and to the full extent.

LLC NORD WIND has got satisfactory solvency index Globas-i® because of the information about the participation as a defendant in arbitration court proceedings in terms of debt collection, unclosed enforcement orders and loss in the balance sheets. Projected growth of the index is stable.

JSC TRANSAERO AIRLINES has got low solvency index Globas-i® due to the information about claim for recognition of the company bankrupt, listing in the blacklist of suppliers, unclosed enforcement orders and loss in the balance sheets. Projected growth of the index is negative.

Seven out of TOP-10 companies decreased indicators of revenue compared to the previous period or have loss in 2015 (marked with red shading in Table 1).

In the TOP-100 group 53 lossmaking companies were observed in 2014, and in 2015 the amount insignificantly decreased to 52.

In general, monetary indicators of passenger transportations in 2016 have grown compared to 2010 (except for taxi transportations), that is confirmed by data from the Federal State Statistics Service (Table 3).

Table 3. Revenue (net) of passenger transportation services (minus VAT, excises and other statutory payments), th RUB
Type of passenger transportation20102011201220132014201520162016 to 2010, %
Scheduled air transport 383 468 090 462 801 843 555 009 646 647 696 800 647 734 812 800 879 312 943 788 636 146
Other scheduled land transport 221 218 593 243 591 843 262 093 658 275 516 742 299 906 865 315 496 370 344 539 442 56
Railway backbone transport 126 339 471 168 499 283 225 403 027 238 174 601 232 785 908 231 417 020 269 024 137 113
Urban electric transport 105 132 380 122 574 362 134 769 343 134 123 195 149 231 508 160 869 125 176 806 915 113
Automobile (bus) scheduled transport 115 371 219 120 476 784 126 953 757 138 283 128 148 558 682 151 403 886 152 226 256 32
Intra-urban automobile (bus) scheduled transportations 93 011 551 97 243 721 104 052 116 115 099 278 126 488 948 129 472 148 131 675 112 42
Underground 71 877 854 82 852 474 93 357 108 92 309 091 105 082 890 111 479 422 131 326 069 83
Nonscheduled air transport 21 314 554 14 801 226 11 563 326 18 956 009 54 171 380 65 995 239 46 968 613 120
Other land transport 26 105 409 25 322 227 30 280 212 36 059 091 47 300 396 49 030 510 38 541 742 48
Tramway transportations 19 250 939 20 029 252 21 089 025 23 249 932 23 344 031 29 340 618 25 717 386 34
Trolley bus transportations 13 506 290 15 936 329 16 696 068 15 089 821 17 093 400 15 716 685 15 711 528 16
Inland water transport 1 539 154 4 211 332 4 186 707 4 722 625 3 945 674 2 903 341 14 440 178 838
Suburban scheduled automobile (bus) transportations 10 289 459 12 568 305 13 333 307 13 200 025 13 863 063 13 205 285 11 215 752 9
Funicular, ropeway and elevator transportations 199 593 198 876 362 254 663 858 1 818 415 2 792 303 4 606 756 2 208
Intra-urban and suburban railway transportations 489 372 3 746 914 3 578 382 3 465 622 3 363 348 3 703 046 4 051 932 729
Maritime transport 772 271 364 609 564 708 316 833 299 127 311 548 3 691 043 378
Taxi 3 045 371 2 930 484 2 424 045 1 714 089 758 524 1 251 386 933 488 -69
*) In Table 3 decrease of revenue is marked with red shading and growth with green.

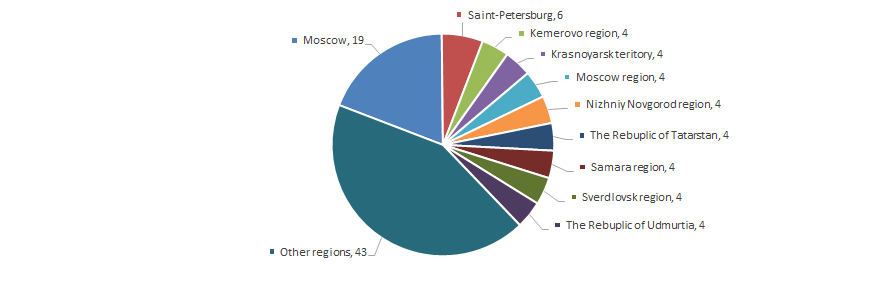
The enterprises for passenger transportation are distributed on the territory of the country equally, attracting to the thickly populated regions because of specific activity. It is confirmed by data from the Information and Analytical system Globas-i®, according to that the 100 largest companies in terms of revenue volume for 2015 are registered in 42 regions of Russia. (Picture 3).

Distribution of the 100 largest Russian companies for passenger transportation according to the regions of Russia
Picture 3. Distribution of the 100 largest Russian companies for passenger transportation according to the regions of Russia
Ranking
Accounts payable turnover of the largest Russian leasing companies

Information agency Credinform prepared a ranking of Russian leasing companies. The enterprises with the largest volume of revenue (TOP-10) were selected for the ranking, according to the data from the Statistical Register for the latest available periods (for 2014 and 2015). Then they were ranked by accounts payable turnover (Table 1).

Accounts payable turnover (times in a year) is calculated as the relation of average accounts payable for the period to sales revenue. The ratio shows how many times a year an enterprise has discharged the average amount of its accounts payable.

This indicator reflects the process of debt repayment to contractors (partners, suppliers, mediators etc.). The coefficient determines the number of firm's closed debts and is calculated to estimate cash flows. It allows to draw conclusions about the effectiveness of company’s work and chosen financial strategy.

The higher is the ratio value, the soonest an enterprise settles accounts with its suppliers. Reduction of turnover can mean as well problems with payment of invoices, as more effective organization of relationships with suppliers, which provides a more profitable, deferred payment schedule and uses accounts payable as a source of cheap financial resources.

The specialists of the Information agency Credinform, taking into account the actual situation both in the economy as a whole and in the sectors, has developed and implemented in the Information and Analytical system Globas-i the calculation of practical values of financial ratios, which can be recognized as normal for a particular industry. For leasing companies the practical value of the accounts payable turnover is up to 338,29 times.

For getting of the most comprehensive and fair picture of the financial standing of an enterprise it is necessary to pay attention to all available combination of company’s financial indicators and ratios.

Table 1. Net profit, revenue, accounts payable turnover, solvency index Globas-i® of the largest Russian leasing companies (TOP-10)
Name, INN, regionNet profit (loss) for 2015, mln RUBRevenue for 2015, mln RUBRevenue for 2015, by 2014, +/- %Accounts payable turnover, times in 2015Solvency index Globas-i®
SPETSNEFTETRANS LLC
INN 7743712642 Moscow
888,1 4 500,3 78 3 059,19 272
High
PAO ROSAGROLIZING
INN 7704221591 Moscow
-9 679,1 3 258,1 13 847,41 228
High
NITROKHIMPROM LLC
INN 7718196987 Moscow
170,6 3 320,6 2 138 541,80 221
High
RN-AIRCRAFT LLC
INN 7706734415 Moscow
6 540,9 8 649,2 57 110,16 242
High
RAIL1520 LLC
INN 7801537819 Leningrad region
661,2 8 172,5 116 82,90 297
High
NAO PROMTRANSINVEST
INN 7730714748 Moscow
604,4 8 189,2 220 62,21 227
High
TATNEFT – AKTIV LLC
INN 1644013875 Republic of Tatarstan
129,4 2 727,1 28 41,11 199
The highest
BRANSVIK REIL LLC
INN 7705872331 Moscow
-4 435,7 7 271,8 -2 35,73 307
Satisfactory
GTI MENEDZHMENT LLC
INN 7701409186 Moscow
591,2 3 096,4 182 35,62 266
High
AGGREKO EURASIA LLC
INN 7705838531 Tyumen region
962,6 2 879,3 40 30,52 189
The highest
Total in the group of TOP-10 companies -3 566,4 52 064,4 *73 **219,62  
Total in the group of TOP-100 companies -5 419,1 118 128,5 *38 **168,67  
Industry average value/strong> -0,6 25,7 -9 299,38  
* - group average value
** - group average value without extreme values

The average values of accounts payable turnover in 2015 as well in the group of TOP-10, as in the group TOP-100 companies stay within parameters of the practical value. However, three from TOP-10 companies (marked with a yellow filling in Table 1 and in Picture 1) have not met these parameters.

Accounts payable turnover and revenue of the largest Russian leasing companies (TOP-10)
Picture 1. Accounts payable turnover and revenue of the largest Russian leasing companies (TOP-10)

The volume of revenue of 10 the largest companies is 44% of the total revenue of 100 the largest enterprises. It points to a relatively high level of monopolization in this industry. Thus, the shares of the largest firms in terms of revenue in 2015 made 21% in the total revenue of the group of TOP-100 companies. (Picture 2).

Shares of TOP-10 enterprises in the total revenue of the group of TOP-100 companies for 2015, %
Picture 2. Shares of TOP-10 enterprises in the total revenue of the group of TOP-100 companies for 2015, %

Nine from TOP-10 companies got the highest or high solvency index Глобас-i®U, that points to their ability to repay their debts in time and fully.

BRANSVIK REIL LLC got satisfactory solvency index Глобас-i® due to the information on its participation as a defendant in arbitration court proceedings in terms of debt collection, on cases of untimely fulfillment of its obligations, as well as the loss in the structure of balance sheet indicators. The forecast for index development is stable.

Three from TOP-10 companies have reduced indicators of revenue in 2015 compared to the previous period or have a loss (are marked with red filling in Table 1).

In the group of TOP-100 companies there were 27 unprofitable companies in 2014, and in 2015 their number decreased to 25.

The indicators of Russian leasing companies in monetary terms have not been stable in recent years and are under pressure of the macroeconomic situation in the economy as a whole, that is confirmed by the data of the Federal State Statistics Service (Picture 3 и Table 2).

Growth rates (rates of drawdown) of the total revenue of Russian leasing companies from year to year, %
Picture 3. Growth rates (rates of drawdown) of the total revenue of Russian leasing companies from year to year, %

In 2016 the largest revenue was by companies, renting various machines and equipment, household products and personal demand items, and the least – by firms, renting commercial equipment.

Table 2. Revenue (nett) from the sale of leasing services (net of value added tax, excises and other similar obligatory payments), thousand rubles.
Leasing of:2010 г.2011 г.2012 г.2013 г.2014 г.2015 г.2016 г.
of machines and equipment without an operator; leasing of household goods and personal demand items 63 467 670 77 222 139 88 113 719 108 117 783 121 148 285 103 362 858 104 108 554
of other machines and equipment 25 264 865 25 433 896 47 951 336 50 196 942 62 816 332 32 490 160 40 497 161
of other vehicles and equipment 15 706 913 25 300 835 35 119 421 49 848 191 49 013 587 55 432 777 39 723 982
of other land vehicles and equipment 15 043 107 24 398 446 34 275 436 48 822 363 47 422 878 54 864 194 38 113 449
of other motor vehicles and equipment 11 841 822 11 196 123 16 619 904 37 801 692 24 444 882 16 996 705 24 158 204
of cars 21 993 809 26 039 448 4 420 659 7 048 439 8 622 268 14 728 340 23 127 046
construction machines and equipment with an operator 13 125 243 12 682 238 15 288 568 12 835 733 13 873 017 11 880 186 19 554 487
construction machines and equipment 4 367 491 5 129 657 21 907 065 33 184 819 45 563 304 12 229 349 17 663 857
of other machines and equipment n.e.c. 15 719 453 16 401 560 20 240 909 12 335 964 12 940 284 14 499 193 17 462 162
of marine vehicles with crew; provision of switching and shunting 844 300 1 909 186 2 715 643 2 577 702 7 779 949 9 509 885 16 470 901
of railway transport and equipment 3 201 285 13 202 323 17 655 532 11 020 671 22 109 752 31 719 497 13 240 146
of other machines and equipment of scientific and industrial purpose 14 607 391 12 256 677 13 945 837 6 852 309 11 276 546 11 074 771 10 588 322
agricultural machinery and equipment 4 180 878 2 884 220 4 718 951 4 543 027 4 224 450 5 715 931 5 012 810
of cargo motor transport with an driver 2 740 842 4 939 978 3 949 999 3 865 291 4 344 440 5 416 675 4 239 681
of air vehicles and equipment 192 422 260 913 194 394 114 708 77 536 60 226 1 123 294
of water vehicles and equipment 471 384 641 476 649 591 700 782 1 297 544 186 218 487 239
of mining and oilfield equipment 555 962 4 137 040 6 247 895 1 651 801 258 833 403 6208 398 153
office machines and equipment, including computing hardware 997 043 1 018 459 1 084 411 131 762 88 294 45 687 358 332
shop equipment 400 750 4 889 5 811 7 103 6 213 6 523 6 683
*) In Table 3 the red filling marks the decline in revenue, green filling – the growth.

The leasing enterprises are distributed unevenly throughout the country, leaning toward two the biggest cities, where the largest financial resources are concentrated. This is confirmed by data of the Information and Analytical system Глобас-i, according to which 100 the largest companies in terms of revenue for 2015 are registered in 32 regions of Russia (Picture 4).

Distribution of 100 the largest leasing enterprises by regions of Russia
Picture 4. Distribution of 100 the largest leasing enterprises by regions of Russia