Changes in legislation
The Supreme Court of Russia made an important decision concerning protection of entrepreneurs from allegation of group crimes.
Law enforcement practice often shows examples of accusing entrepreneurs of creating a criminal community on the sole basis of their work in one company.
The Article 210 of the Criminal Code of Russia contains the following features of organization of criminal association:
- leadership of the criminal association or its constituent units;
- coordinating the actions of organized groups and creating sustainable links between them;
- development of plans and conditions to commit crimes;
- division of the spheres of criminal influence and incomes between groups.
Note to the Article adopted by the Federal law from April 1, 2020 No 73-FL states that working in one company must not classified as action in an organized criminal group.
At the same time, the Article 35 of the Criminal Code of Russia contains the provision that commission of a group crime, commission of a group crime by prior conspiracy, commission of a crime by an organized group or criminal association (criminal organization) entails more severe punishment.
In this regard, the Plenum of the Supreme Court of Russia made a special explanation about the possible guilt of economic crimes as part of a group of persons. When giving a legal assessment of such crimes, the courts should substantiate the following facts:
- whether each accomplice has intention to commit a crime as a part of a group of persons,
- whether there is a preliminary agreement between them on the joint commission of criminal acts,
- direct participation of each accomplice in the commitment of all or part of criminal acts.
Trends in Moscow’s economy in time of crisis
Information agency Credinform has prepared a review of activity trends of the largest companies of Moscow’s real economy sector during the financial crisis of 2008-2009.
The largest companies (ТОP-1000) in terms of annual revenue were selected according to the data from the Statistical Register for the latest available periods (2006 - 2011). The analysis was based on data of the Information and Analytical system Globas.
Number of active companies
Within 2006 - 2011 the number of active companies was growing, however in time of crisis and in the beginning of recovery, the growth rate was decreasing..
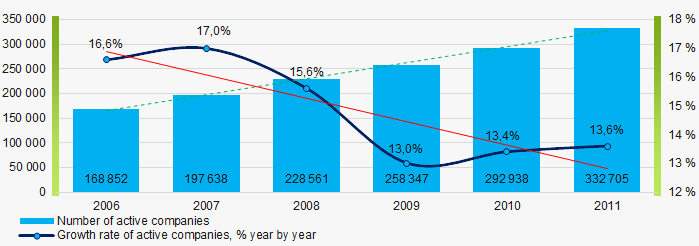 Picture 1. Dynamics of active companies in 2006 – 2011
Net assets is a ratio reflecting the real value of company's property. It is calculated annually as the difference between assets on the enterprise balance and its debt obligations. The ratio is considered negative (insufficiency of property), if company’s debt exceeds the value of its property.
The largest company in terms of net assets was JSC GASPROM, INN 7736050003. In 2011 net assets of the company amounted to more than 7540 billion RUB. In 2019 the indicator amounted to more than 11334 billion RUB.
The smallest size of net assets in TOP-1000 hadJSC ZAVOD IMENI I.A. LIKHACHEVA, INN 7725043886. The lack of property of the company in 2011 was expressed in negative terms -7,5 billion RUB and -205,7 billion RUB in 2019.
Within 2006-2011, the average values of TOP-1000 net assets showed the growing tendency, however the growth rate was decreasing during the acute phase of crisis in 2008 (Picture 2).
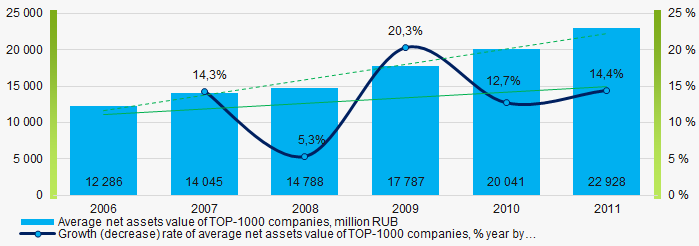 Picture 2. Change in average net assets value of ТОP-1000 companies in 2006– 2011
In general, within 2006 - 2011, the share of ТОP-1000 enterprises with lack of property was decreasing (Picture 3). Within the acute phase of crisis in 2008, the share of enterprises with lack of property was growing.
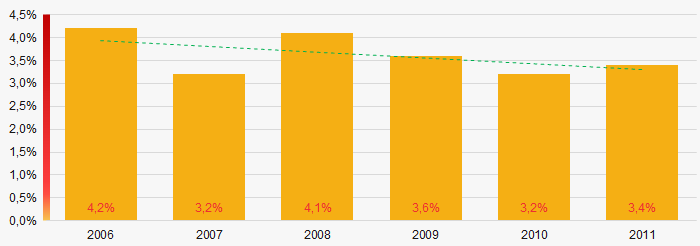 Picture 3. The share of enterprises with negative net assets value in ТОP-1000 in 2006 – 2011
Sales revenue
The largest company by sales revenue was also JSC GASPROM, INN 7736050003. In 2011 the indicator amounted to more than 3534 billion RUB and more than 4758 billion RUB in 2019.
In general, the growing trend in sales revenue with decreasing growth rate was observed (Picture 4).
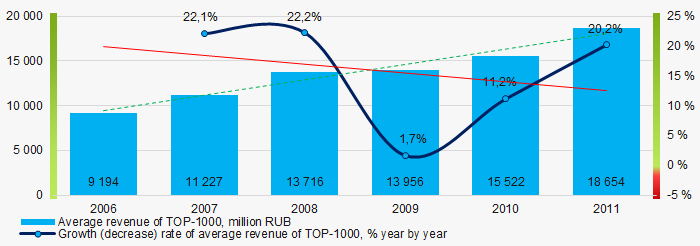 Picture 4. Change in average revenue of TOP-1000 in 2006 – 2011
Profit and loss
The largest company in terms of net profit was also JSC GASPROM, INN 7736050003. In 2011 the company’s profit amounted to 879,6 billion RUB and 651,1 million RUB in 2019.
Within 2006 – 2011, the average profit values of TOP-1000 showed the growing tendency with significant decrease in the growth rate in 2008 (Picture 5).
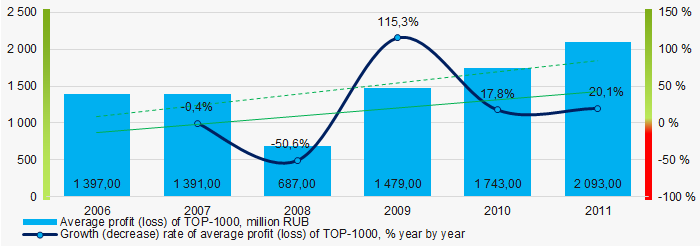 Picture 5. Change in average profit (loss) of TOP-1000 in 2006 – 2011
 In 2006 – 2011 the average net profit values of ТОP-1000 showed the growing tendency, along with this the average net loss was increasing (Picture 6).
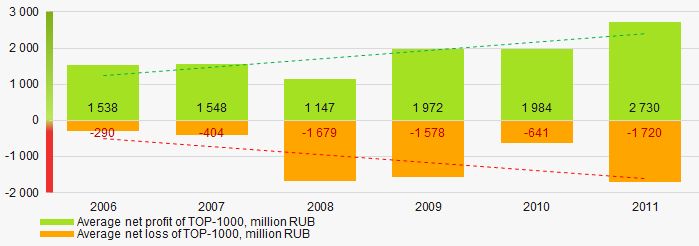 Picture 6. Change in average net profit/loss of ТОP-1000 in 2006 – 2011
Main financial ratios
In 2006 – 2011 the average values of the current liquidity ratio were higher than the recommended values - from 1,0 to 2,0, with growing trend (Picture 7).
The current liquidity ratio (ratio of total working capital to short-term liabilities) shows the sufficiency of company’s assets to meet short-term obligations.
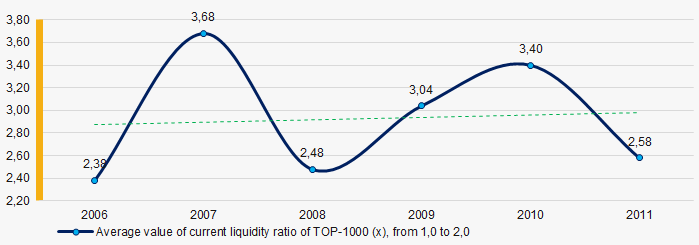 Picture 7. Change in average values of current liquidity ratio of TOP-1000 companies in 2006 – 2011
Within 2006 - 2011 the decreasing trend of the average values of ROI ratio with significant downward trend in 2011 was observed (Picture 8).
The ROI ratio is calculated as a ratio of net profit to sum of stockholder equity and long-term liabilities and shows the return from equity involved in commercial activities and long-term borrowed funds.
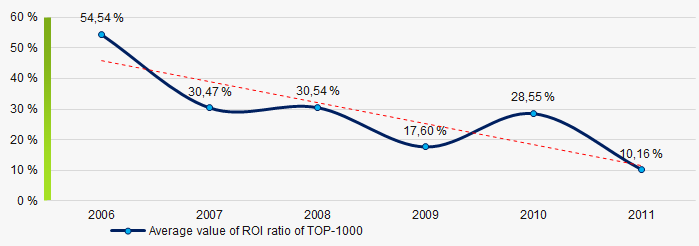 Picture 8. Change in average values of ROI ratio in 2006 – 2011
Assets turnover ratio is the ratio of sales revenue and company’s average total assets for a period. It characterizes the effectiveness of using of all available resources, regardless the source of their attraction. The ratio shows how many times per year the full cycle of production and circulation is performed, generating the corresponding effect in the form of profit.
In 2006 – 2011 this business activity ratio demonstrated the decreasing trend with drop within the acute phase of crisis (Picture 9).
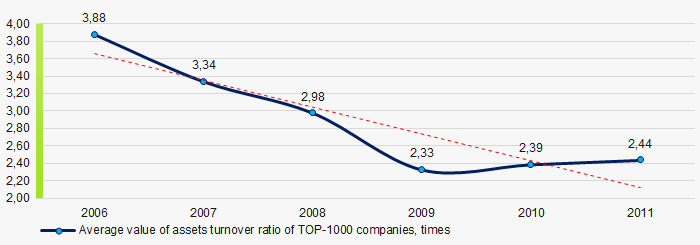 Picture 9. Change in average values of assets turnover ratio of TOP-1000 companies in 2006 – 2011
Small businesses
15% of ТОP-1000 companies are registered in the Unified register of small and medium-sized enterprises of the Russian Federal Tax Service. Herein, in 2011 their share in TOP-1000 total revenue amounted to only 1,6% (Picture 10).
 Picture 10. Revenue of small and medium-sized enterprises in 2011
 Financial position score
An assessment of the financial position of TOP-1000 companies shows that in 2020 the largest part has the above average financial position (Picture 11).
 Picture 11. Distribution of TOP-1000 companies by financial position score in 2020
Solvency index Globas
In 2020 the most of TOP-1000 companies got superior/high or strong/medium Solvency index Globas, this fact shows the ability of the companies to meet their obligations in time and fully (Picture 12).
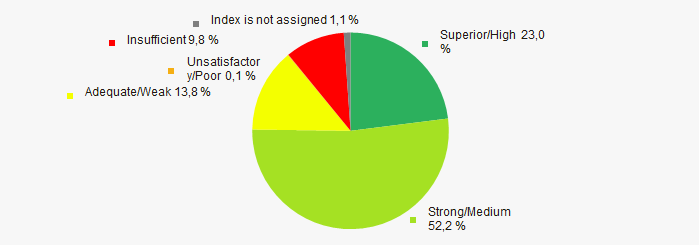 Picture 12. Distribution of TOP-1000 companies by Solvency index Globas
Conclusion
A complex assessment of activity of the largest Russian companies of Moscow’s real economy sector, taking into account the main indexes, financial ratios and indicators, demonstrates the presence of positive trends within 2006-2011 (Table 1).
| Trends and assessment factors | Relative share, % | Possible forecast |
| Dynamics of active companies |  10 10 |
|
| Growth rate of active companies |  -10 -10 |
During the acute phase of crisis, the number of active companies may decrease |
| Dynamics of average net assets value |  10 10 |
|
| Growth/drawdown rate of average net assets value |  10 10 |
During the acute phase of crisis, the growth rate of average net assets may decrease |
| Increase / decrease in the share of enterprises with negative net assets |  10 10 |
During the acute phase of crisis number of enterprises with negative net assets may increase |
| Dynamics of average revenue |  10 10 |
|
| Growth/drawdown rate of average revenue |  -10 -10 |
In time of crisis, the growth rate of revenue may decrease |
| Dynamics of average profit |  10 10 |
During the acute phase of crisis the average profit may decrease |
| Growth/drawdown rate of average net profit (loss) |  10 10 |
During the acute phase of crisis the growth rate of average net profit may average net profit |
| Increase / decrease in average net profit of companies |  10 10 |
During the acute phase of crisis the net profit may decrease |
| Increase / decrease in average net loss of companies |  -10 -10 |
In time of crisis and its recovery the net loss may increase |
| Increase / decrease in average values of current liquidity ratio |  5 5 |
During the acute phase of crisis the current liquidity ratio may decrease |
| Increase / decrease in average values of ROI ratio |  -10 -10 |
In time of crisis, the ROI ratio may decrease |
| Increase / decrease in average values of assets turnover ratio, times |  -10 -10 |
In time of crisis, the business activity is declining and during the recovery - is slowly growing |
| Financial position (the largest share) |  10 10 |
|
| Solvency index Globas (the largest share) |  10 10 |
|
| Average value of factors |  2,6 2,6 |
 favorable trend (factor),
  unfavorable trend (factor).