
Order a report
Custom-made industry research, company ratings, competitor analysis


Trends for Novosibirsk companies
Information agency Credinform has prepared a review of trends of the largest operating companies of Novosibirsk region. ДThe largest enterprises ((TOP-10 and TOP-1000)) in terms of annual revenue were selected for the analysis according to the data from the Statistical Register for the latest available periods (2013-2017). The analysis was based on the data of the Information and Analytical system Globas.
Net assets are total assets less total liabilities. This indicator reflects the real value of the property of an enterprise. When the company’s debt exceeds the value of its property, the indicator is considered negative (insufficiency of property).
| № | Name, INN, activity | Net assets value, bln RUB | Solvency index Globas | ||||
| 2013 | 2014 | 2015 | 2016 | 2017 | |||
| 1 | 2 | 3 | 4 | 5 | 6 | 7 | 8 |
| 1 | JSC SIBERIAN ANTHRACITE INN 5406192366 Anthracite opencast mining |
|
|
|
|
|
205 Strong |
| 2 | JSC SIBERIAN ENERGY COMPANY INN 5405270340 Electricity generation by thermal power plants In process of reorganization in the form of merger of other legal entities since 17.08.2018 |
|
|
|
|
|
219 Strong |
| 3 | JSC NOVOSIBIRSK CHEMICAL CONCENTRATES PLANT INN 5410114184 Nuclear fuel production |
|
|
|
|
|
159 Superior |
| 4 | MUUP OF NOVOSIBIRSK GORVODOKANAL INN 5411100875 Water distribution for drinking and industrial needs |
|
|
|
|
|
186 High |
| 5 | JSC REGIONAL POWER GRIDS INN 5406291470 Power transmission and technological connection to distribution grids |
|
|
|
|
|
203 Strong |
| 996 | JSC NOVOSIBIRSK INDUSTRIAL UNION SIBSELMASH INN 5404220321 Production of steam and hot water (heat energy) by boiler rooms In liquidation since 25.10.2012 |
|
|
|
|
|
600 Insufficient |
| 997 | JSC SIBMOST INN 5407127899 Construction of roads and highways |
|
|
|
|
|
337 Adequate |
| 998 | JSC NOVOSIBSTROISERVIS INN 5406260792 Buying and selling of own residential property |
|
|
|
|
|
320 Adequate |
| 999 | LLC TORGOVY KVARTAL-NOVOSIBIRSK INN 5405230467 Lease and management of own or leased nonresidential real estate |
|
|
|
|
|
272 Medium |
| 1000 | LLC ZAPSIB-TRANSSERVIS INN 4205004518 Auxiliary transport activities A case of recognition the company bankrupt is considering |
|
|
|
|
|
550 Insufficient |
![]() — growth of indicator in comparison with prior period,
— growth of indicator in comparison with prior period, ![]() — decrease of indicator in comparison with prior period.
— decrease of indicator in comparison with prior period.
For the last 5 years, the average values of net assets showed the decreasing tendency (Picture 1).
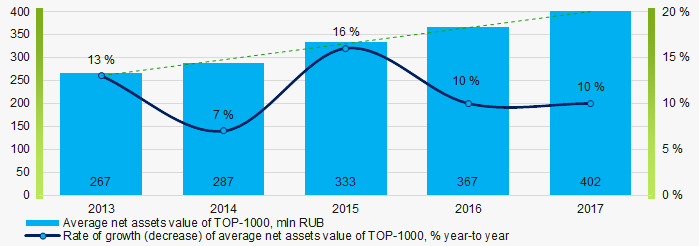 Picture 1. Change in average net assets value in 2013 – 2017
The shares of TOP-1000 companies with insufficient property have trend to decrease over the past five years (Picture 2).
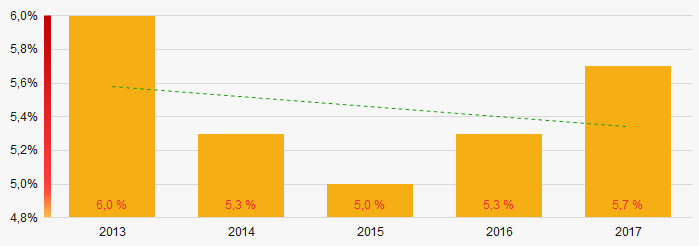 Picture 2. Shares of companies with negative net assets value in TOP-1000
Sales revenue
In 2017 total revenue of 10 largest companies was 40% of TOP-1000 total revenue (Picture 3). This testifies high level of concentration of capital in Novosibirsk region.
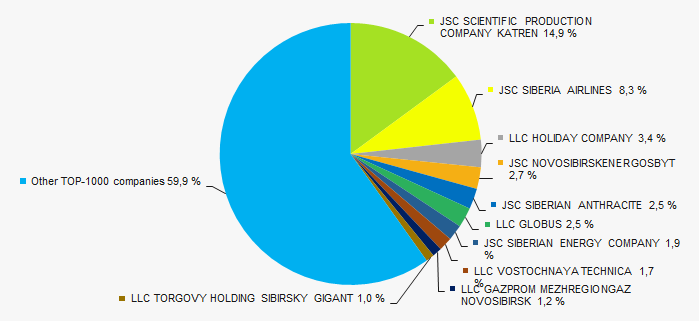 Picture 3. Shares of TOP-10 companies in TOP-1000 total profit for 2017
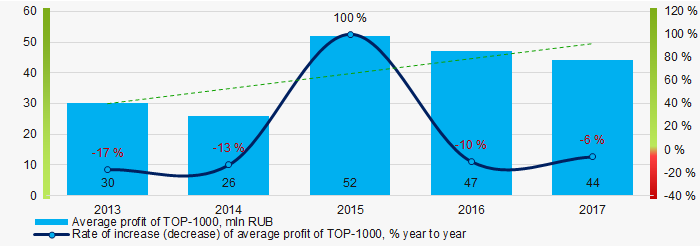
In general, there is a trend to increase in revenue (Picture 4).
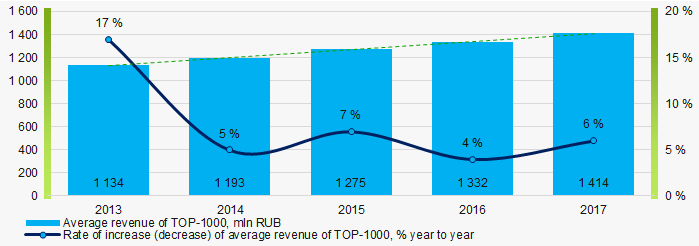 Picture 4. Change in average net profit in 2013-2017
Profit and loss
In 2017, profit of 10 largest companies in the region amounted to 42% of TOP-1000 total profit (Picture 5).
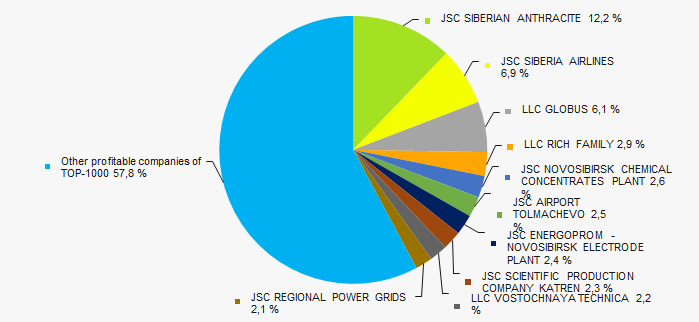 Picture 5. Shares of TOP-10 companies in TOP-1000 total profit for 2017
For the last ten years, there is an increase of the average industry net profit values (Picture 6).
 Picture 6. Change in average net profit (loss) in 2013-2017
For the five-year period, the average net profit values of TOP-1000 companies show the increasing tendency. At the same time, the average net loss also increases (Picture 7).
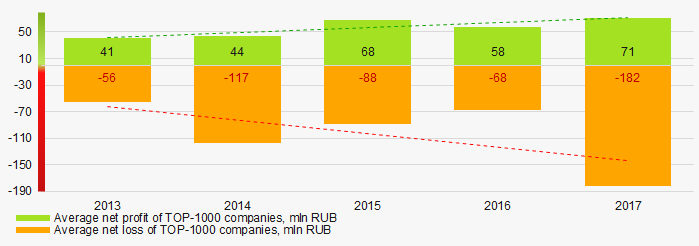 Picture 7. Change in average profit and loss of ТОP-1000 in 2013 – 2017
Key financial ratios
For the last five years, the average values of the current liquidity ratio were above the recommended one - from 1,0 to 2,0 with a trend to increase (Picture 8).
Current liquidity ratio (current assets to short-term liabilities) shows the sufficiency of company’s assets to repay on short-term liabilities.
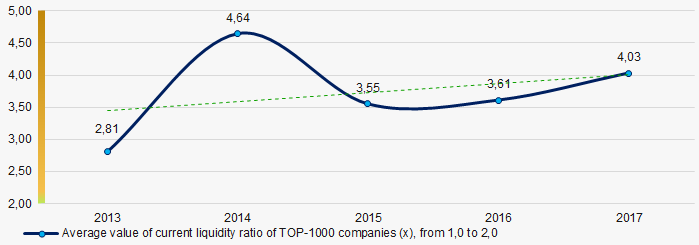 Picture 8. Change in average values of current liquidity ratio in 2013 – 2017
For the last five years, there is relatively high level of ROI ratio with a trend to decrease (Picture 9).
ROI ratio is calculated as net profit to sum of shareholders equity and long-term liabilities, and shows the return of equity involved in commercial activities and long-term borrowed funds.
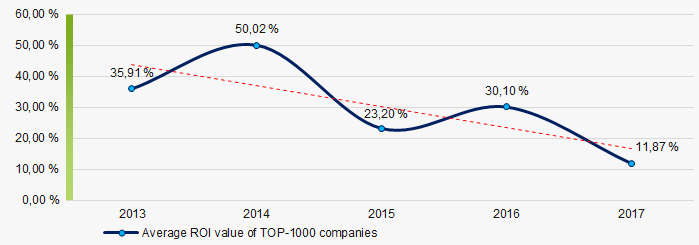 Picture 9. Change in average values of ROI ratio in 2013 – 2017
Assets turnover ratio is the ratio of sales revenue and company’s average total assets for a period. It characterizes the effectiveness of using of all available resources, regardless the source of their attraction. The ratio shows how many times per year the full cycle of production and circulation is performed, generating the corresponding effect in the form of profit.
For the last five years, business activity ratio demonstrated the downward trend (Picture 10).
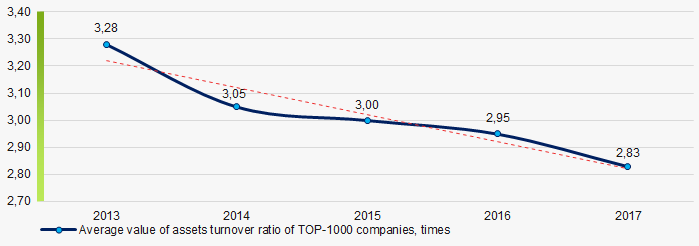 Picture 10. Change in average values of assets turnover ratio in 2013 – 2017
Production structure
The highest share in total revenue of TOP-1000 falls for companies engaged in wholesale and passenger air transport enterprises (Picture 11).
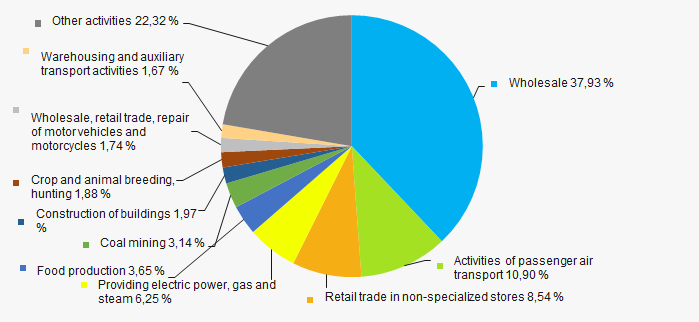 Picture 11. Distribution of activity types in total revenue of TOP-1000, %
70% companies of TOP-1000 are registered in the Register of small and medium-sized businesses of the Federal Tax Service of the Russian Federation. Their share in total revenue of TOP-1000 companies is 24% (Picture 12).
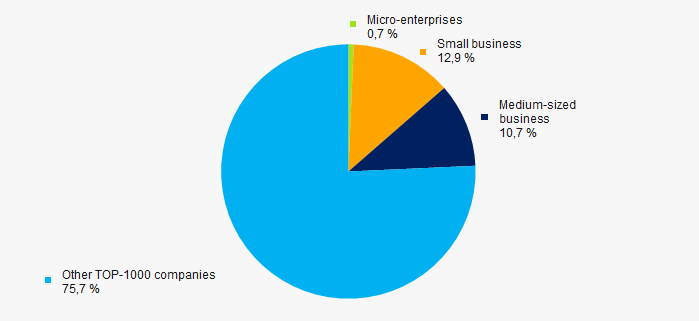 Picture 12. Shares of small and medium-sized enterprises in TOP-1000, %
Main regions of activity
Companies of TOP-1000 are unequally located across the country and registered in 28 districts. Companies largest by revenue are located in Novosibirsk itself (Picture 13).
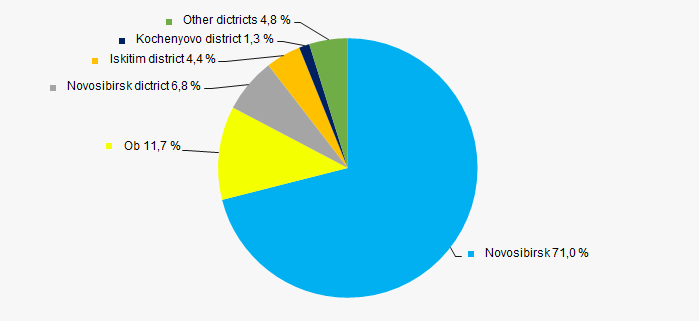 Picture 13. Distribution of TOP-1000 revenue by districts of Novosibirsk region
Financial position score
Assessment of the financial position of TOP-1000 companies shows that more than half of them have financial position above average (Picture 14).
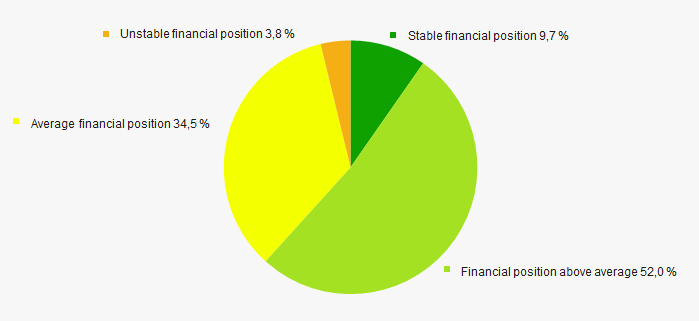 Picture 14. Distribution of TOP-1000 companies by financial position score
Solvency index Globas
Most of TOP-1000 companies got Superior/High or Strong/Medium Solvency index Globas, this fact shows the ability to meet their obligations in time and fully (Picture 15).
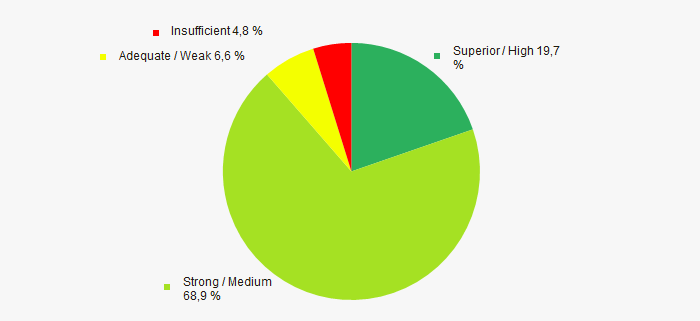 Picture 15. Distribution of TOP-1000 companies by solvency index Globas
Index of industrial production
According to the Federal State Statistics Service (Rosstat), during 12 months of 2017 - 2018, the trend to decrease of industrial production indexes is observed. For 9 months of 2018, the index decreased by 1,1% at average, and increased by 2,6% for the period of November 2017 – October 2018 (Picture 16).
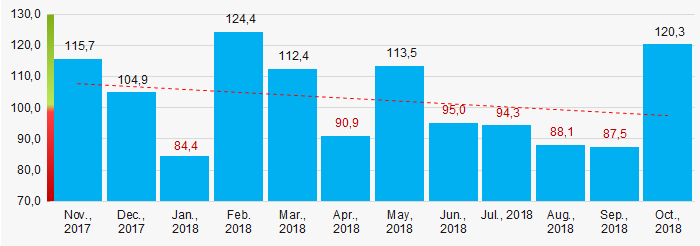 Picture 16. Index of industrial production in Novosibirsk region in 2017 – 2018, month-to-month (%)
According to the same data, the share of companies of Novosibirsk region in total revenue from sales of goods, products, works and services for 6 months of 2018 is 0,99% countrywide.
Conclusion
Complex assessment of activity of the largest operating companies of Novosibirsk region, taking into account the main indexes, financial ratios and indicators, demonstrates the prevalence of favorable trends (Table 2).
| Trends and evaluation factors of TOP-1000 companies | Relative share of factors, % |
| Rate of growth (decline) in the average size of net assets | |
| Increase / decrease in the share of enterprises with negative values of net assets | |
| Rate of growth (decline) in the average size of revenue | |
| Concentration level of capital | |
| Rate of growth (decline) in the average size of profit (loss) | |
| Growth / decline in average values of companies’ net profit | |
| Growth / decline in average values of companies’ net loss | |
| Increase / decrease in average values of total liquidity ratio | |
| Increase / decrease in average values of return on investment ratio | |
| Increase / decrease in average values of asset turnover ratio, times | |
| Share of small and medium-sized businesses in the region in terms of revenue being more than 30% | |
| Regional concentration | |
| Financial position (the largest share) | |
| Solvency index Globas (the largest share) | |
| Industrial production index | |
| Average value of relative share of factors | |
![]() — positive trend (factor),
— positive trend (factor), ![]() — negative trend (factor).
— negative trend (factor).