Ranking
Accounts payable turnover of the largest Russian travel companies

Information Agency Credinform has prepared the ranking of the largest Russian travel companies by accounts payable turnover. 

The largest enterprises in terms of revenue were selected according to the data from the Statistical Register for the latest available period (for the year 2014). Then, the companies were ranged by decrease in accounts payable turnover ratio (TOP-10).

Accounts payable turnover (times per year) – is a ratio of average accounts payable for a period to sales revenue. The ratio shows how many times within a year the enterprise paid its average accounts payable.

The ratio reflects the repayment process of the debt to contractors (partners, suppliers, agents etc.). It identifies the number of debt repayments and is calculated for cash flows assessment. The ratio helps to make a conclusion about the efficiency of company’s activity and its strategic financial management.

The higher is the ratio, the faster the enterprise pays to the suppliers. Low ratio value may testify about problems with bill payment as well as more effective relationship with suppliers, provides more favorable deferred payment schedule and uses accounts payable as a source of cheap financial resources.

For the most full and fair opinion about the company’s position, the whole set of financial and non-financial indicators and ratios should be taken into account.   

Table 1. Net profit, revenue, dynamics of short-term and long-term liabilities, accounts payable turnover and solvency index Globas-i of the largest travel companies (TOP-10)
NName, INN, region2014 net profit, th RUB2014 revenue, th RUB2014/2013 revenue, %2014/2013 short-term and long-term liabilities, %Accounts payable turnover, times per yearSolvency index Globas-i®
1 NAO CITY CENTER OF  BOOKING AND TOURISM
INN 7707113869
Moscow region
9 335 1 061 228 85 77 350,92 258 High
2 JOINT STOCK COMPANY INTERCONNECT MANAGEMENT CORPORATION
INN 7728580286
Moscow
298 154 831 455 21 105 182,83 212 High
3 South Cross Travel LLC
INN 7707650655
Moscow
1 753 1 530 916 81 286 172,82 550 Unsatisfactory
4 S 7 TRAVEL RETAIL LLC
INN 7701607660
Moscow
69 269 907 537 129 96 160,07 236 High
5 SVOY TOUR AND TRAVEL
INN 7730633954
Moscow
-22 289 1 098 191 111 60 151,71 337 Satisfactory
6 ACADEMSERVICE LTD
INN 5024053441
Moscow region
2 662 3 580 755 102 104 93,51 189 The highest
7 DANKO TRAVEL COMPANY
INN 7704524814
Moscow
38 451 1 188 419 96 96 80,70 266 High
8 LIMITED LIABILITY COMPANY VODOHOD
INN 7707511820
Moscow
-64 702 2 907 212 96 115 70,53 218 High
9 Grand Baikal LLC
INN 3808079832
Irkutsk region
50 906 534 871 103 146 53,17 191 The highest
10 INTERCOM LLC
INN 7708676102
Moscow
179 869 970 449 89 131 46,15 265 High

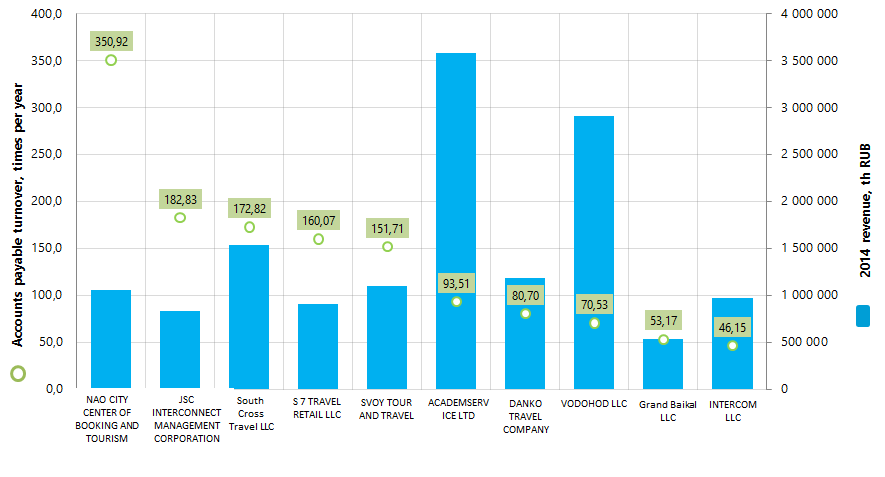
Accounts payable turnover of the largest travel companies (TOP-10) varies from 350,92 times per year (NAO CITY CENTER OF BOOKING AND TOURISM) to 46,15 times (INTERCOM LLC). In 2014 the average ratio among travel industry amounted to 152,28 times. 4 leading companies from the Top-10 list have indicators higher than this value. 

8 out of 10 participants have high and the highest solvency index Globas-i. This fact shows the ability of the companies to meet their obligations in time and fully; the risk of unfulfillment is low.   

SVOY TOUR AND TRAVEL LLC has the satisfactory solvency index Globas-i in connection with its participation as a defendant in debt collection arbitration proceedings. The solvency level doesn’t guarantee the repayment of debts in time and fully. 

South Cross Travel LLC has unsatisfactory solvency index Globas-i due to the submitted bankruptcy notice. Besides, in comparison with 2013, the company demonstrates the significant growth of debt obligations in 2014 among TOP-10 participants. 

Picture 1. Accounts payable turnover and revenue of the largest travel companies (TOP-10)

accounts payable turnover and revenue of the largest travel companies

The companies from the TOP-10 list as well as enterprises within industry as a whole have high accounts payable turnover. Thus, in 2014 with the average value of the indicator for travel industry 152,28 times, the indicator of electric grid companies amounted to only 28,16 times, perfumes manufacturers 59,92 times.

According to 2014 results, the annual revenue of TOP-10 industry leaders amounted to 14,6 bln RUB, that is 19% lower than total revenue in 2013. At the same time, only 4 companies from the TOP-10 list improved the revenue indicators in comparison with the previous year.

However, the data from the Statistical Register for 2014-2015 (Table 2) demonstrates the growing revenue of travel companies in 2015 and simultaneous growth of debts to suppliers and contractors.

Table 2. Sales revenue and payables to suppliers and contractors within Russian travel industry in 2014 – 2015
Russian Federation, Tourism201420152015/2014, %
Net sales proceeds of goods, products, works and services (less the value added tax, excises and other similar compulsory payments) (th RUB)   1 411 635 887 1 719 242 724 122
Payable to suppliers and contractors for goods, works and services (th RUB) 189 908 171 233 983 756 123

Analysis of the distribution across the country of 50 largest travel companies in terms of 2014 revenue indicates about high concentration of business in Moscow – the largest financial center of the country and the city with the most credit worthy population (Table 3).

Table 3. TOP-5 of Russian regions by the number of largest registered travel companies   
RegionThe number of registered companies from TOP-50 largest enterprises in terms of 2014 revenue
Moscow 32
Saint-Petersburg 5
Moscow region 3
Sverdlovsk region 3
Irkutsk region 2
Khabarovsk region 2
Herald
Foreign direct investment “took a break”

Despite the ongoing recession for the second year, namely the 5th consecutive quarter, sanctions and general decline in business activity, Russia does not give up the idea of hosting the major international economic forums. In the current challenging to business environment, especially with Western partners, the country aims to attract investment. The largest of the upcoming events is XX jubilee St. Petersburg International Economic Forum (SPIEF), which will be held in June 16-18, 2016.

Retrospective analysis of attracted foreign capital dynamics is of particular interest today, especially in view of the known complications (see Picture 1). Currently, in addition to sanctions, there is a "recommended" ban by a number of foreign countries’ authorities to support contacts with Russian counterparties and government agencies. This applies to the largest foreign companies and the banking sector.

It must be said that in many respects the sanctions policy has its negative consequences: according to the results of 2015 the volume of foreign direct investment (hereinafter - FDI) was "modest" 4,8 bln USD, the lowest level since 2002. The reduction of funds involved to the level of 2014 amounted to more than 78%. In comparison to the "pre-crisis" 2013, the investment "collapsed" by 93%. In the previous crisis of 2009 investment totaled now unattainable 36,6 bln USD.

At a non-comparable scale and structure of the economy compared to 2002, the current situation with investment obviously was caused by external administrative reasons, little conjugated with free market rules, capital flow and fair competition.

Total volume of accumulated foreign direct investment for the whole monitoring period (according to the Bank of Russia) since 1994 to 2015 reached 513,9 bln USD.

Dynamics of foreign direct investment in Russia from 1994 to 2015, bln USDPicture 1. Dynamics of foreign direct investment in Russia from 1994 to 2015, bln USD

Change in the regional structure of FDI origin (see Picture 2) is also interesting. From 2007 to 2013 in the period prior to sanctions and deterioration of relations with the West, the highest total amount of FDI stock fell on Cyprus, the Netherlands and Luxembourg.

Regional structure of accumulated FDI origin for 2007-2013, % of total volumePicture 2. Regional structure of accumulated FDI origin for 2007-2013, % of total volume

After the worsening of the Russian geopolitical relations with Europe and the United States, the origin of FDI structure has reversed. At the end of 2014-2015, 28% of the total FDI stock came from the Bahamas island state, 16% from the British Virgin Islands, the territory which are not subject to the EU directives (see Picture 3). The Republic of Cyprus has lost its role of leading country of FDI origin in the Russian Federation.

Regional structure of accumulated FDI origin for 2014-2015, % of total volumePicture 3. Regional structure of accumulated FDI origin for 2014-2015, % of total volume

If we examine the structure of accumulated FDI by sectors (see Picture 4), it is possible to identify the most attractive segments of the Russian economy to foreign capital. In the period of 2010-2015 after the crisis of 2008-2009, the majority of investment came in the wholesale and retail trade; financial and insurance activities and manufacturing. The leading export-oriented industry – mining - received only 14,6% of the total FDI accumulated in the last 6 years.

Common myths that "the Russian oil industry will not survive without western investment", or that "Russia produces nothing and invest nothing except the primary hydrocarbon feedstock" do not stand up to facts-based criticism.

Sector structure of accumulated FDI origin for 2010-2015, % of total volumePicture 4. Sector structure of accumulated FDI origin for 2010-2015, % of total volume

In monetary terms, the volume of accumulated FDI for 2010-2015 in wholesale and retail trade reached 64,7 bln USD; 51,6 bln USD in financial and insurance activities, and 46,8 bln USD in manufacturing (see Table 1).

Table 1. Total volume of accumulated FDI by sectors for 2010-2015, bln USD

Business activity typebln USD
1 Wholesale and retail trade 64,7
2 Financial activities, insurance 51,6
3 Manufacturing 46,8
4 Mining operation 35,8
5 Other services 14,3
6 Construction 12,7
7 Real estate 8,9
- Others 10,2

Most of FDI in manufacturing (see Table 2) for 2010-2015 are focused on investment in production of coke and petroleum products (20,9 bln USD). Thus, investment in companies producing products with high added value are comparable to investment in the whole sphere of mining (35,8 bln USD).

Chemical production ranks second in attractiveness for foreign investors and accumulates 5,4 bln USD.

Table 2. Total volume of accumulated FDI in manufacturing industry for 2010-2015, bln USD

Sectors of manufacturing industrybln USDShare, %
  Manufacturing industry, including: 46,8 100
1 Production of coke, oil products and nuclear materials 20,9 44,6
2 Chemical production 5,4 11,5
3 Production of food products, including beverages and tobacco 4,9 10,4
4 Manufacture of vehicles and equipment 4,2 8,9
5 Manufacture of other non-metallic mineral products 2,8 6,1
6 Manufacture of electrical equipment, electronic and optical equipment 2,6 5,5
7 Manufacture of machinery and equipment 1,9 4,0
8 Manufacture of rubber and plastic products 1,3 2,7
9 Processing of wood and manufacture of wood products 1,1 2,4
10 Pulp and paper industry; publishing and printing 0,9 1,9
11 Metallurgical manufacture, manufacture of fabricated metal products 0,5 1,0
12 Other manufacturing 0,3 0,6
13 Textile and clothing manufacture 0,1 0,3
14 Manufacture of leather, leather products and footwear 0,0 0,1

Among the most attractive RF subjects the first place is obviously taken by Moscow, which attracted 57% of all FDI for 2011-2015, that is 115,1 bln USD in monetary terms. This fact is not surprising: according to the Information and analytical system Globas-i, 1,1 mln of a total 4,8 mln active legal entities are registered in Moscow on May 1, 2016.

On the second place with a considerable gap from the capital is Tyumen region (without Autonomous Okrugs) with 29,3 bln USD invested in it.

Saint-Petersburg closes the top three. The city on the Neva received 15,4 bln USD over the past 5 years.

Currently, the Russian business has developed mainly at the expense of its profit, which reduces in companies focused on domestic demand. This is connected with the decrease in consumer activity.

Artificial restriction of capital movement laws will lead to underfunding of potentially attractive sectors of economy bringing high rate of return to the Western investors. Being apparently for a long time under sanctions, and taking into account the impossibility of attracting domestic credit at low interest, Russia may face problems in the future. In order to avoid strengthening the negative trends it is necessary to continue to attract investors from other markets and loosen monetary policy by increasing the stock of money and reduction of interest rates.

In addition to the macroeconomic instruments, Russia can rely on attracting investment through the issuance of sovereign bonds. This has just occurred in late May 2016. For the first time since the introduction of the sanctions the country has placed its Eurobonds in the amount of 1,75 bln USD. 1,2 bln USD were purchased by foreign participants, and the Russian banks bought about 550 mln USD. Experts originally anticipated limited demand among foreign investors due to the fact that the transaction involved no foreign banks, as well as considering the fact that the calculations on the bonds will pass through Russia, not through leading international companies. However, the total volume of order book (demand) amounted to about 7 bln USD. Thus, Russia's return to the international capital market can be considered as quite successful.