
Order a report
Custom-made industry research, company ratings, competitor analysis


TOP consumer lending companies
Information agency Credinform presents a ranking of the Russian companies in the field of consumer lending. The largest companies engaged in providing consumer loans (TOP 10 and TOP 100) in terms of annual revenue for the last reporting periods available in the state statistics bodies and the Federal Tax Service (2018-2020) were selected for the ranking. They were ranked according to return on costs ratio (Table 1). Selection of companies and analysis were carried out on the basis of data from the Information and Analytical system Globas.
Return on costs (%) is calculated as a ratio of profit before tax to the total cost of production and sales of products and reflects amount of income per RUB spent.
It is necessary to pay attention to the entire set of indicators and financial ratios to get the most complete and objective picture of enterprise's financial condition.
| Name, INN, region | Revenue, million RUB | Net profit, (loss), million RUB | Return on costs, % | Globas Solvency Index | |||
| 2019 | 2020 | 2019 | 2020 | 2019 | 2020 | ||
| 1 | 2 | 3 | 4 | 5 | 6 | 7 | 8 |
| MAENA AGRICULTURAL CONSUMER CREDIT COOPERATIVE INN 1426006109 Sakha Republic (Yakutia) |
|
|
|
|
|
|
228 Strong |
| LLC DZP-DEVELOPMENT INN 7838513677 Saint Petersburg |
|
|
|
|
|
|
297 Medium |
| LLC MICROCREDIT COMPANY VDM-FINANCE INN 3123328823 Belgorod Region |
|
|
|
|
|
|
307 Adequate |
| CREDIT CONSUMER COOPERATIVE CREDIT-SERVICE INN 2207008793 Altai Territory |
|
|
|
|
|
|
271 Medium |
| LLC MICROCREDIT COMPANY BYUROFINPOMOSHI INN 3123328830 Belgorod Region |
|
|
|
|
|
|
306 Adequate |
| LLC MICROCREDIT COMPANY BOLSHEVOLZHSKAYA INN 5010051290 Moscow Region |
|
|
|
|
|
|
303 Adequate |
| LLC MICROCREDIT COMPANY SERVICE CENTER FOR INDIVIDUALS DALNEVOSTOCHNII ZAIM INN 2801164075 Amur Region |
|
|
|
|
|
|
326 Adequate |
| LLC YASEN INN 1651078288 Tatarstan Republic |
|
|
|
|
|
|
336 Adequate |
| LLC MICROCREDIT COMPANY DOBRIE DENGI INN 5612073237 Orenburg Region |
|
|
|
|
|
|
340 Adequate |
| CREDIT CONSUMER COOPERATIVE SEMYA INN 3436008444 Stavropol Territory in process of being wound up since 14.09.2020 |
|
|
|
|
|
|
600 Insufficient |
| TOP 10 average value | |
|
|
|
|
|
|
| TOP 100 average value | |
|
|
|
|
|
|
| Industry average value | |
|
|
|
|
|
|
![]() improvement of the indicator to the previous period,
improvement of the indicator to the previous period, ![]() deterioration of the indicator to the previous period
deterioration of the indicator to the previous period
The average indicators of the return on costs ratio of the TOP-10 and the TOP-100 companies in 2020 are significantly higher than the industry average. Four companies from the TOP 10 had negative indicators in both 2020 and 2019. The decline in indicators in 2020 was observed in six of the TOP-10 companies, while in 2019 there were only two such companies.
At the same time, in 2020, seven companies reduced revenue and five companies reduced net profit.
The drop in average revenue in the TOP 10 and the TOP 100 was almost 17% and the industry average increased by 13%.
Average profit in the TOP 10 increased by 33%, in the TOP 100 it decreased by 4 times and the average decline in the industry amounted to 2 times bigger value.
In general, over the past 5 years, average industry indicators of the return on costs ratio have been negative for two periods. Growth was observed only for o ne period. The indicator reached the best results in 2017 and the worst result were shown in 2020. (Picture 1).
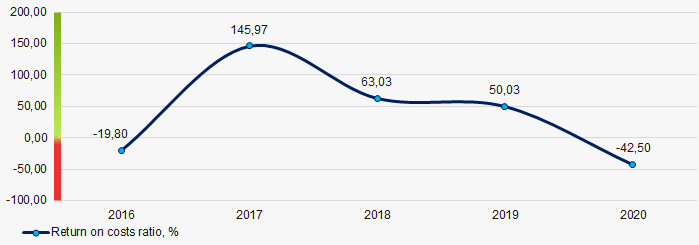 Picture 1. Changes in average industry values of the return on costs ratio of consumer lending companies in 2016-2020.