Changes in legislation
The Federal law of July 13, 2020 No. 196-FL introduced a number of significant changes to the legislation governing the activities of consumer credit cooperatives, pawnshops and microfinance organizations.
Credit cooperatives
The law clearly defines the goals of creating credit cooperatives:
- organization of mutual financial assistance to members and associate members by combining share contributions, attracted funds in the form of loans, and other funds;
- placing funds through loans to members of cooperatives to meet their financial needs.
A mandatory requirement for the full name of credit cooperatives is the content of the word "credit".
Persons with criminal history on record for economic crimes or crimes against public authorities cannot be elected or appointed to the management boards, supervisory boards, to the positions of chairpersons or executive directors.
The Central Bank of the Russian Federation, when exercising control and supervisory functions over the activities of credit cooperatives, has the right to establish the forms, terms, procedure for drawing up and submitting reporting documentation.
Pawnshops
In addition, the Central Bank exercises supervisory functions over the activities of pawnshops and maintains the State Register of Pawnshops. Legal entities acquire the status of a pawnshop from the date of entering information about them in this state register and, accordingly, lose such status from the date of exclusion from it.
The absence within one year of concluded loan agreements secured by movable things or agreements for their storage are one of the main grounds for excluding a pawnshop from the state register.
The law also provides that the amount of loans provided by a pawnshop may not exceed the amount of assessment of the pledged items.
Microfinance organizations
The law establishes that such organizations are required to have an official website on the Internet with a domain name included in the group of domain names that make up the Russian national domain zone. Information in the field of personal data is subject to mandatory publication on such sites and in customer service points. The list of such information, the procedure and timing of their disclosure are also set by the Central Bank.
The federal law will come into force on October 10, 2020.
The subscribers of the Information and Analytical system Globas are able to get acquainted with the activities of all credit cooperatives, pawnshops and microfinance organizations. Globas totally contains data on over 8 thousand active organizations of this sector.
Economy in Novosibirsk in crisis years
Information agency Credinform has prepared a review of the activity trends of the companies of real economy in Novosibirsk during the financial crisis of 2008 – 2009 years.
The largest enterprises (TOP-1000) in terms of annual revenue were selected for the analysis according to the data from the Statistical Register for the period of 2006 – 2011 years. The analysis was based on the data from the Information and Analytical system Globas.
The number of active companies
From 2006 to 2011, the number of active companies increased, but the growth rates decreased especially during the acute phase of the crisis.
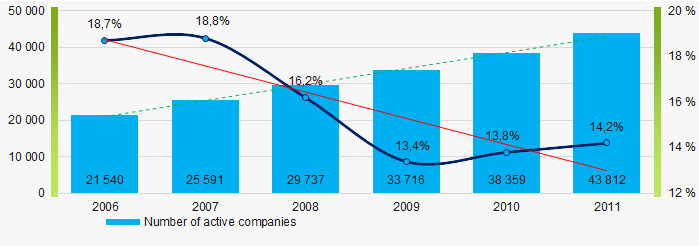 Picture 1. Change in the number of active companies in 2006 – 2011
Net assets are total assets less total liabilities. This indicator reflects the real value of the property of an enterprise. When the company’s debt exceeds the value of its property, the indicator is considered negative (insufficiency of property).
The largest company of the real sector of economy in Novosibirsk in term of net assets was JOINT STOCK COMPANY SIBERIAN ENERGY COMPANY, INN 5405270340.
In 2011, net assets value of the company amounted to almost 14 billion RUB. In 2019, the figure was almost 23 billion RUB.
The lowest net assets value among TOP-1000 was recorded for LLC TORGOVY KVARTAL-NOVOSIBIRSK, INN 5405230467. In 2011, insufficiency of property of the company was indicated in negative value of -2,8 billion RUB, and -3,2 billion RUB in 2018.
In 2006-2011, the average net assets values of TOP-1000 had a trend to increase, and the growth rates were in general decreased during the acute phase of the crisis and the beginning of its recovery. (Picture 2).
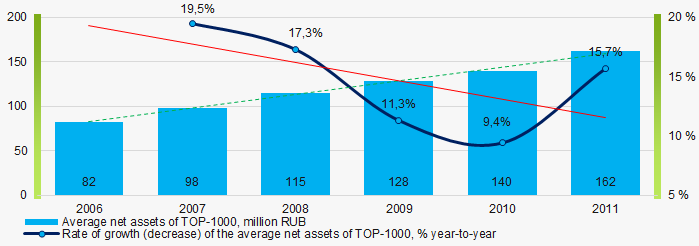 Picture 2. Change in average net assets value of TOP-1000 in 2006 – 2011
The shares of TOP-1000 companies with insufficient property have trend to increase in 2006-2011(Picture 3).
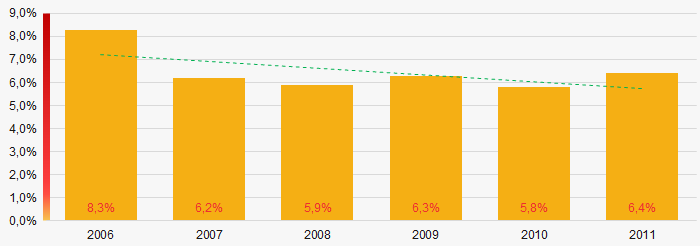 Picture 3. Shares of companies with negative net assets value of TOP-1000 in 2006 – 2011
Sales revenue
The largest company of the real sector of economy in Novosibirsk by revenue was JSC KATREN, INN 5408130693. The revenue volume exceeded 79 billion RUB in 2011, and almost reached 185 billion RUB in 2019.
In general, there was a trend to increase in revenue with decreasing growth rate (Picture 4).
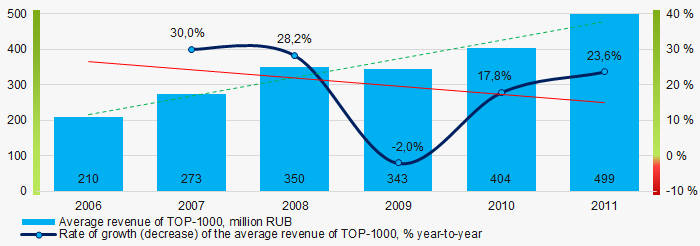 Picture 4. Change in average revenue of TOP-1000 in 2006 – 2011
Profit and loss
The largest company in term of net profit was BROKERCREDITSERVICE LTD, INN 5406121446. The company’s profit exceeded 5 billion RUB in 2011, and 137 billion RUB in 2017.
During the period of 2006 – 2011, the average profit figures of TOP-1000 companies had a trend to increase with the insignificantly increasing growth rates. (Picture 5).
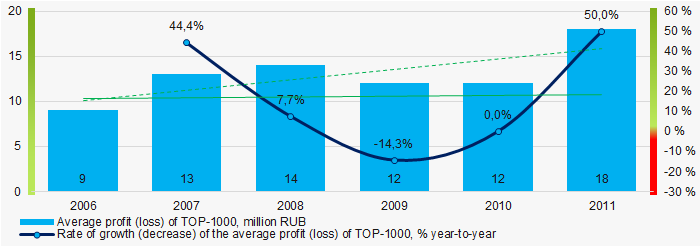 Picture 5. Change in average profit (loss) of TOP-1000 in 2006- 2011
In 2006 – 2011, the average net profit figures of TOP-1000 companies had a trend to increase with the increasing average net loss (Picture 6).
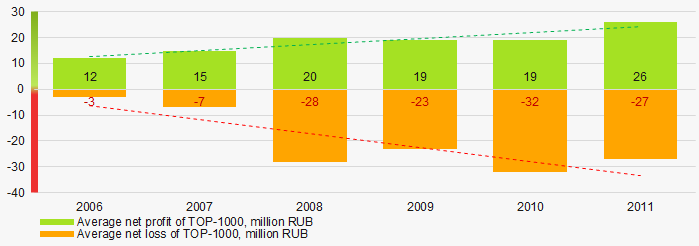 Picture 6. Change in average net profit and net loss of ТОP-1000 in 2006 – 2011
Key financial ratios
In 2006 – 2011, the average values of the current liquidity ratio of TOP-1000 were above the recommended one – from 1,0 to 2,0, with a trend to decrease. (Picture 7).
Current liquidity ratio (current assets to short-term liabilities) shows the sufficiency of company’s assets to repay on short-term liabilities.
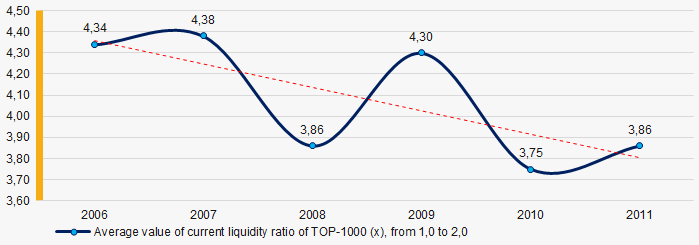 Picture 7. Change in average values of current liquidity ratio of TOP-1000 in 2006 – 2011
At the period of 2006 – 2011, there was a general trend to decrease in the average ROI values of TOP-1000 with a significant decline in 2010 (Picture 8).
ROI ratio is calculated as net profit to sum of shareholders equity and long-term liabilities, and shows the return of equity involved in commercial activities and long-term borrowed funds.
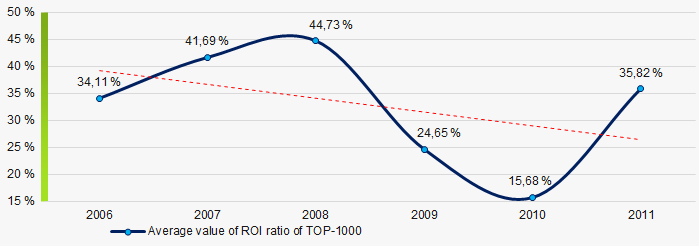 Picture 8. Change in average values of ROI ratio of TOP-1000 in 2006 – 2011
Assets turnover ratio is the ratio of sales revenue and company’s average total assets for a period. It characterizes the effectiveness of using of all available resources, regardless the source of their attraction. The ratio shows how many times per year the full cycle of production and circulation is performed, generating the corresponding effect in the form of profit.
In 2006 – 2011, there was a trend to decrease of this ratio (Picture 9).
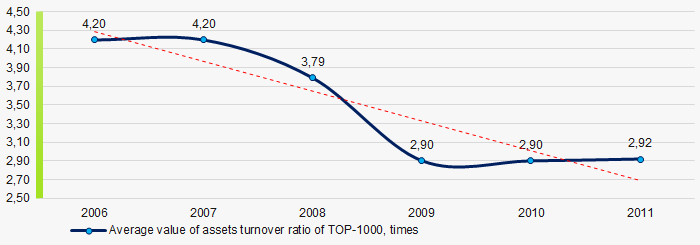 Picture 9. Change in average values of assets turnover ratio of TOP-1000 in 2006 – 2011
Small enterprises
75% companies of TOP-1000 are registered in the Register of small and medium-sized enterprises of the Federal Tax Service of the Russian Federation. However, their share in total revenue of TOP-1000 amounted more than 30% in 2011 (Picture 10).
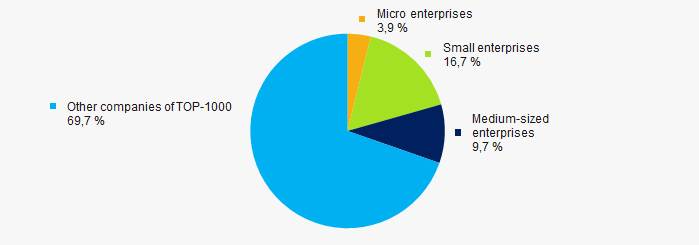 Picture 10. Shares of small and medium-sized enterprises of TOP-1000 in 2011
Financial position score
According to the assessment, the financial position of most of TOP-1000 companies is above average in 2020 (Picture 11).
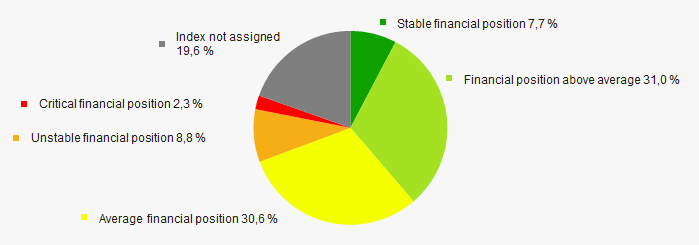 Picture 11. Distribution of TOP-1000 companies by financial position score in 2020
Solvency index Globas
In 2020, most of TOP-1000 companies got Superior / High and Strong index Globas. This fact shows their ability to meet their obligations fully and by the due date (Picture 12).
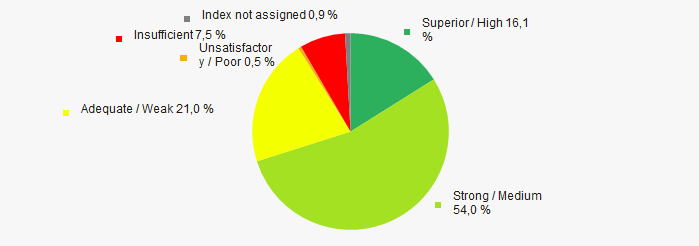 Picture 12. Distribution of TOP-1000 companies by solvency index Globas
Conclusion
Complex assessment of activity of the largest companies of the real economy sector in Novosibirsk, taking into account the main indexes, financial ratios and indicators, demonstrates the prevalence of positive trends in 2006 - 2011 (Table 1).
| Trends and evaluation factors | Relative share of factor, % | Possible forecast |
| Dynamics of the number of active companies |  10 10 |
|
| Rate of growth of the number of active companies |  -10 -10 |
During the acute phase of the crisis and the period of recovery, rate of growth of the active companies may be decreased |
| Dynamics of the average net assets value |  10 10 |
|
| Rate of growth (decline) in the average size of net assets |  -10 -10 |
During the acute phase of the crisis, rate of growth in the net assets may be decreased |
| Increase / decrease in the share of enterprises with negative values of net assets |  10 10 |
|
| Dynamics of the average revenue |  10 10 |
|
| Rate of growth (decline) in the average size of revenue |  -10 -10 |
During the acute phase of the crisis and the period of recovery, rate of growth in revenue may be decreased |
| Dynamics of the average profit |  10 10 |
|
| Rate of growth (decline) in the average size of profit (loss) |  10 10 |
During the acute phase of the crisis, rate of growth in average profit may be decreased |
| Growth / decline in average values of companies’ net profit |  10 10 |
|
| Growth / decline in average values of companies’ net loss |  -10 -10 |
During the acute phase of the crisis and the period of recovery, net loss may be increased |
| Increase / decrease in average values of total liquidity ratio |  -5 -5 |
|
| Increase / decrease in average values of return on investment ratio |  -10 -10 |
During the acute phase of the crisis and the period of recovery, return on investment ratio may by decreased |
| Increase / decrease in average values of asset turnover ratio, times |  -10 -10 |
Business activity may by decreased during the acute phase of the crisis, and will be slowly increased during the period of recovery |
| Share of small and medium-sized businesses in terms of revenue being more than 20% |  10 10 |
|
| Financial position (the largest share) |  10 10 |
|
| Solvency index Globas (the largest share) |  10 10 |
|
| Average value of relative share of factors |  2,1 2,1 |
 positive trend (factor),
  negative trend (factor).