
Order a report
Custom-made industry research, company ratings, competitor analysis


Banks will know their customers better
Through the Federal law from 07.08.2001 № 115-FL «On counteracting the legalization (laundering) of proceeds received by criminal way and terrorism financing», credit institutions will receive data on accounts of companies and individual entrepreneurs in third party banks in the forthcoming summer. This data will be provided by the Federal Tax Service (FTS) through the system of interdepartmental online interactions on a round-the-clock basis.
Such kind of data is necessary for credit institutions at companies check in accordance with Art. 7 «Rights and obligations of organizations engaged in cash transactions» of the mentioned Federal law, as well as at shell companies identification and assessment of would-be borrowers at lending.
For example, information about accounts in other banks may indicate the fact of company’s virtual operating. This is one of the signs of trustworthiness. According to the experts, transparentizing of clients’ activity to banks can accelerate the opening of accounts, consideration of applications for credit and upgrading the outstanding credits monitoring.
In the future, increased competition on the corporate funds market will probably take place.
For reference
According to the Central Bank of RF, the volume of loans, deposits and other placed funds granted to organizations, individuals and banks in roubles is ever-increasing (Picture 1).
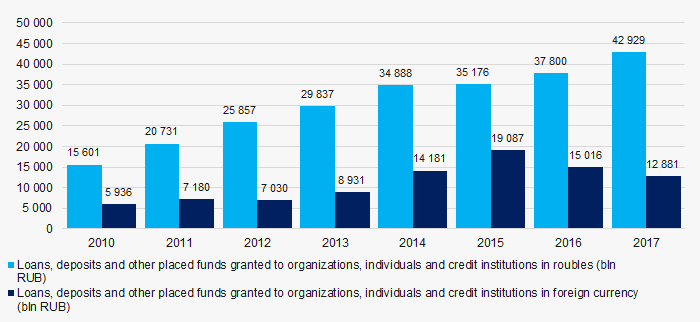 Picture 1. Loans, deposits and other placed funds granted to organizations, individuals and credit institutions for 2010 — 2017
Users of the Information and Analytical system Globas have a possibility to get acquainted with activity of all bank and non-bank credit institutions and their branches with active licenses. Information about all credit institutions with revoked licenses and their branches is also available.