Ranking
Product profitability ratio of the Russian oil refining companies

Information Agency Credinform has prepared the ranking of the Russian oil refining companies` products. Top-10 enterprises in terms of annual revenue were selected by experts according to the data from the Statistical Register for the latest available period (2014) with oil refining activity. The enterprises were ranked by decrease in the product profitability ratio.

Product profitability is calculated as the ratio of revenue to amount of expenses from ordinary activities. Generally, profitability reflects economic efficiency of production, and product profitability index helps to understand whether output of one or another product is reasonable. There are no specified values for indicators of this group, because they vary strongly depending on the industry.

Product profitability ratio and solvency index of the Russian oil refining companies
NameRevenue of 2014, th RUBRevenue of 2014 to 2013, %%Product profitability ratio, %Solvency index GLOBAS-i®
1 OJSC SIBUR HOLDING
INN 7727547261
285 545 215 117 34,47 261 High
2 LLC LUKOIL-VOLGOGRADOILREFINING
INN 3448017919
259 702 962 106 21,13 158 The highest
3 PJSOC Bashneft
INN 0274051582
582 128 345 112 17,05 189 The highest
4 LLC LUKOIL-Permnefteorgsintez  
INN 5905099475
291 049 782 105 12,39 165 The highest
5 LLC LUKOIL-Nizhegorodnefteorgsintez
INN 5250043567
369 313 857 105 9,80 153 The highest
6 OJSC TAIF-NK
INN 1651025328
132 010 468 104 9,77 219 High
7 LLC NefteGazIndustriya-Invest
INN 277105194
87 281 447 126 9,52 260 High
8 OJSC  Gazprom-Neftekhim Salavat 
INN 266008329
190 633 900 114 4,25 280 High
9 LLC LUKOIL-UCHTAOILREFINING
INN 1102057865
83 214 664 104 3,81 221 High
10 JSC Antipinsky Refinery
INN 7204084481
124 624 801 179 2,10 315 Satisfactory

OJSC SIBUR HOLDING takes the lead in the ranking with the product profitability index 34,47%. This is high result twice exceeding industry average index 15,78%  and showing the smallest primecost of products in the industry. The company has got high solvency index Globas-i® that shows the ability of the company to pay off the debts in time and to the full extent. 

product profitability ratio

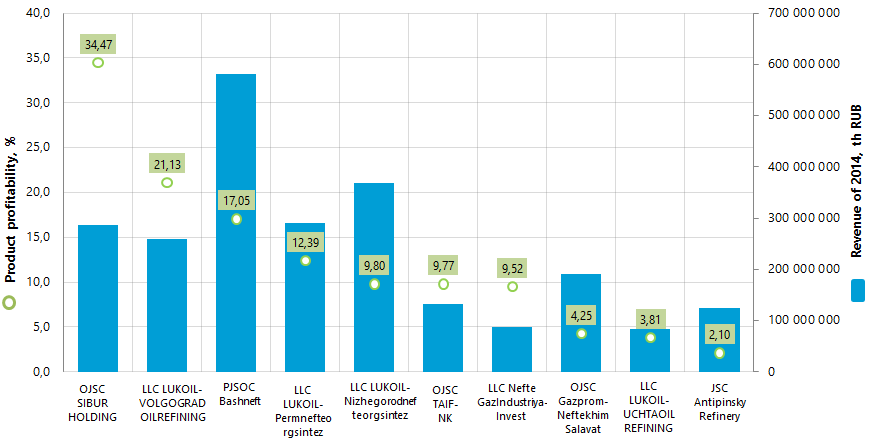
PJSOC Bashneft, showed at the end of 2014 the highest in the industry results according to the revenue value, takes the third place of the ranking with the product profitability index 17,05%, that is close to the industry average index. The enterprise has got the highest solvency index Globas-i® that is a characteristic of high ability to pay off the debts.  

However, it worth mentioning that enterprises of the LUKOIL group take the leading position according to the total revenue volume in the industry. This group is represented in the TOP-10 list with four enterprises. The total revenue volume is more than 1,3 trillion RUB that is almost 42% of the TOP-10 total revenue volume. Product profitability indexes of the LUKOIL group range from 21,13% to 3,81%. 

JSC Antipinsky Refinery has got the lowest product profitability index among TOP-10 enterprises. Summarizing financial and nonfinancial data, the company has got satisfactory solvency index Globas-i® that is not a guarantee for paying the debts in time and to the full extent. However, this particular enterprise has shown the largest revenue value of 2014 to 2013. Nevertheless, this achievement is negated by the 34 bln RUB loss of 2014 and decreasing product profitability index from 6,29% in 2012 to 2,1% - in 2014. 

In general, oil refining companies operate profitably, but demonstrate soft decrease in the average product profitability index: 22,41% - in 2010; 18,7% - in 2011; 15,99% - in 2012; 15,71% - in 2013, with small increase to 15,78% - in 2014. This happened on the back of relatively stable average revenue indexes and high (up to the middle of 2014) global oil prices.  

According to the Federal State Statistics Service (Rosstat), in 2015, first in the last few years, 2,4% decrease in primary crude oil processing was observed. Further scenario remains to be seen. According to experts, reserves of the industry are in structural changes and more advanced oil refining.

Article
Crisis bailout plan: events of near-term and mid-term prospect

The economic situation in the beginning of 2016 didn’t kick start to country’s development and still doesn’t encourage optimism. Giant scale volatility in world market oil prices, the ruble-dollar rates and stock markets showed the groundlessness of 2016 forecasts and made the involved organizations (The Ministry of Economic Development, the Central Bank of Russia, the Ministry of Finance) foresee the possible development of the Russian economy taking into account USD 40, 30, 20 per barrel of oil. In the Table 1 the macroeconomic indicators are represented according to Rosstat (the Federal State Statistics Service) following the results of 2016.  

Table 1. Macroeconomic indicators in Russia, as of year-end 2016  
 January
2016
In % toFor reference
January
2015
December
2015
January2015 in % to
Jan.
2014
Dec. 2014
Gross domestic product, billion RUB 80412,51) 96,32)   100,73)  
Industrial production index4),5)   97,3 80,3 100,9 78,8
Agricultural production, billionRUB 159,0 102,5 58,5 102,8 59,1
Freight turnover, млрд т-км 428,3 100,9 93,3 96,1 95,8
Retail turnover, billionRUB 2125,1 92,7 73,6 96,4 67,3
Volume of charged services to citizens, billion RUB 641,1 97,3 87,9 100,66) 88,16)
External turnover, billion USD 45,97) 72,98) 109,39) 76,78) 105,09)
including: export of goods 28,4 74,0 111,3 77,5 104,4
              import of goods 17,4 71,2 106,2 75,4 106,0
Investments in equity, billion RUB 14555,910) 91,62)   98,53)  
Consumer price index   109,8 101,0 115,0 103,9
Industrial goods manufacturers price index4)   107,5 98,8 107,0 101,3
Total number of the unemployed, million people 4,4 106,2 100,1 97,96) 103,06)
Number of legally registered unemployed, million people 1,0 110,1 101,6 97,36) 102,66)

Under current conditions country’s leadership arrived at the conclusion on necessity of ordinary crisis bailout plan development, though in the end of 2015 the absence of grounds for it had been underlined. The crisis bailout plan has been gelled on the results of multiple discussions, modifications and search for required monetary means on its implementation. It consists of 2 parts: the first one includes urgent or prompt measures, the second – strategic measures focused on mid-term result. 

The prompt measures come down to support of regions and industries, among which:

- provision of financial assistance to the regions on budget deficiency payments, unemployment payments; to monotowns – on training of executives modern ways of project management and creation of comfort urban environment;

- standardization of financial sector, capitalization support of Vnesheconombank, saving of state credit guarantees, granting of subsidies for recovery of several modernization expenses. 

Special focus will be on potentially prospective industries such as car industry, residential building, transport engineering, light industry, agribusiness, in particular:

- in the car industry – prolongation of vehicle scrappage program, soft auto lending,  leasing; subsidization of investments loan payments;  increase of automobile export; renovation of ambulance car fleet; 

- in the construction industry – continuation of support program on mortgage housing credit, subsidization of mortgage interest rates; provision of assistance to mortgage borrowers got into challenging financial situation;

- in the transport engineering – three blocks of measures will be implemented:  measures aimed at accelerated depreciation of life-expired carriages and renovation of freight rolling stock fleet; measures aimed at rolling stock operation safety; measures aimed at support of innovative carriage manufacturers;

- in the light industry – implementation of financial support measures focused on provision of financial resources accessibility and stimulation of demand on the light industry goods;

- in the agriculture – accumulation of existing programs financing,  extension of privileges on domestic machinery purchase, support of small business patterns.

Mid-term measures include the following:

- small business support measures, in particular: increase of simplified tax system threshold to 120 million RUB; prolongation of UTII (Unified Tax on Imputed Income) after 2018; alignment to the unified property tax deduction to the extent of 500 square meters for enterprises using special modes; favorable conditions for the rent of government property; easing of several environmental payments; 

- limitation and arrangement of inspections, improvement of investment climate,  guarantees on participation in state procurement, credit provision assistance, easing of entrance to the market;

- performance of audit procedures for expenses of infrastructural monopolies, government companies, inspection of regulatory legal acts on economic activity;  

- continuation of cost reduction activity, encouragement of non-resource export, development of advanced technologies;

- own-account citizens will get an opportunity to file a voluntary report on implementation of sole proprietorship to tax authorities;


The 2016 crisis bailout plan differs from the 2015 plan for commitment to support of economic sector having potential for development, not the banking sector. The plan is meant as well for the structural reforms, the goal of which is to get benefit from financial contributions in the mid-term prospects. The implementation of underlying measures will make it possible to overcome the negative trends in the economy and to diversify the economy in Russia.


Table references:

1) 2015 figures (first valuation).

2) 2015 in % to 2014.

3) 2014 in % to 2013.

4) By the following types of activity: "Extraction of minerals", "Processing operations", "Production and distribution of electricity, gas and water".

5) Considering adjustment for off-the-books economy.

6) The indicators are calculated without reference to the Republic of Crimea and Sevastopol

7) Figures for December 2015.

8) December 2015 and December 2014 in % to the corresponding period of the previous year, in de facto prices.

9) December 2015 and December 2014 in % to the previous month, in de facto prices.

10) Figures for January-December 2015.