
Order a report
Custom-made industry research, company ratings, competitor analysis


Return on investments in the heat power industry
Information agency Credinform has prepared a ranking of the largest Russian heat power companies. The largest enterprises (TOP-10) in terms of annual revenue were selected according to the data from the Statistical Register for the available periods (2016-2018). Then the companies were ranged by ROI ratio (Table 1). The analysis was based on the data from the Information and Analytical system Globas.
Return on investments (%) is the ratio of net profit (loss) and net assets value. It demonstrates the return level from each ruble, received from the investments. In other words it shows how many monetary units the company used to obtain one monetary unit of net profit. The ratio is used for the assessment of fund raising at interest.
In general, normative values for ROI ratio are not set as they are changing due to the industry in which company operates.
For the most full and fair opinion about the company’s financial position the whole set of financial indicators and ratios should be taken into account.
<
| Name, INN, region | Revenue, million RUB | Net profit (loss), million RUB | ROI ratio, % | Solvency index Globas | |||
| 2017 | 2018 | 2017 | 2018 | 2017 | 2018 | ||
| 1 | 2 | 3 | 4 | 5 | 6 | 7 | 8 |
| NAO TEPLOENERGO INN 5257087027 Nizhny Novgorod region |
|
|
|
|
|
|
211 Strong |
| PJC Territorial Generation Company No.2 INN 7606053324 Yaroslavl region |
|
|
|
|
|
|
204 Strong |
| Bashkir Heat Distribution System LLC INN 0277072661 Republic of Bashkortostan |
|
|
|
|
|
|
235 Strong |
| NAO YAMALKOMMUNENERGO INN 8901025421 Yamalo - Nenets Autonomous Okrug |
|
|
|
|
|
|
278 Medium |
| JSС MOSCOW INTEGRATED POWER COMPANY INN 7720518494 Moscow |
|
|
|
|
|
|
160 Superior |
| JSC QUADRA - POWER GENERATION INN 6829012680 Tula region |
|
|
|
|
|
|
235 Strong |
| GUP TEK SPB INN 7830001028 Saint Petersburg |
|
|
|
|
|
|
208 Strong |
| NAO MURMANENERGOSBYT INN 5190907139 Murmansk region |
|
|
|
|
|
|
288 Medium |
| JSC URAL DISTRICT HEATING COMPANY INN 7203203418 Tyumen region |
|
|
|
|
|
|
278 Medium |
| NAO PTS INN 6315530348 Samara region |
|
|
|
|
|
|
274 Medium |
| Total for TOP-10 companies | |
|
|
|
|||
| Average value for TOP-10 companies | |
|
|
|
|
|
|
| Average industry value | |
|
|
|
|
|
|
![]() growth of indicator in comparison with prior period,
growth of indicator in comparison with prior period, ![]() decline of indicator in comparison with prior period.
decline of indicator in comparison with prior period.
In 2018, the average value of ROI ratio for TOP-10 companies is higher than average industry value. Four companies improved the results.
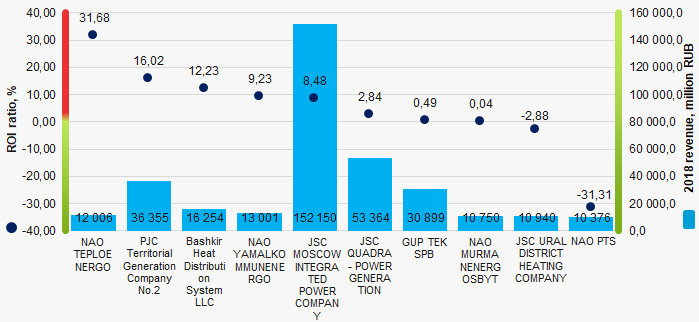 Picture 1. ROI ratio and revenue of the largest heat power companies (ТОP-10)
Within 10 years, the average industry indicators of ROI ratio are in the zone of negative values with the growing tendency. (Picture 2).
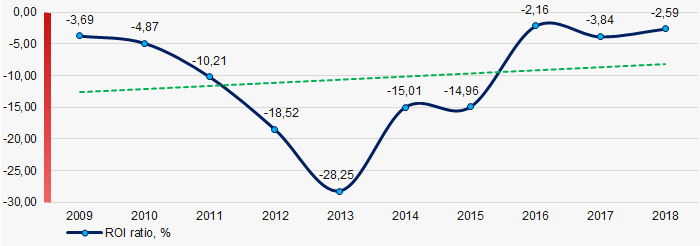 Picture 2. Change in average industry values of ROI ratio of heat power companies in 2009 – 2018