Herald
The number of arbitration cases decreases

The number of administrative and civil arbitration cases has grown steadily since 2016, but since 2018, it has begun to decrease. Over the past two years, the percentage of won disputes has also decreased as well.

Main statistics

According to the Information and Analytical system Globas, 1,6 million cases were registered in the arbitration courts in 2020, that is 18,5% less than in 2019 (all types of cases, excluding bankruptcy ones).

The main reason for this dynamics is restriction of business activity in 2020, granting payment deferrals for counterparties and pre-trial settlement of disputes.

Picture 1. Dynamics of arbitration and civil cases in the federal arbitration courts from 2016 to 2020

More and more disputes are being resolved out of the court

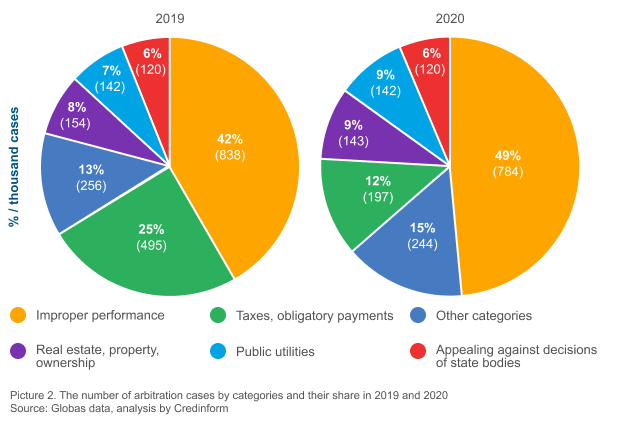
In 2020, there was a 60% decrease in the number of disputes related to the collection of taxes and mandatory payments to the budget of the Russian Federation. Their share in the total number of cases reduced from 25% to 12%. (Picture 2).

This is due to a more accurate identification of tax offenses using digital methods of analyzing the company's activities and to the effective joint work of legal departments and control unit of the Federal Tax Service at the stage of inspections and during pre-trial consideration of tax disputes. If any tax risks are identified at the taxpayers’ activity, they are induced to voluntarily clarification of tax obligations without inspections.

However, there is a tendency that is dangerous for enterprises - judicial practice is not being formed, and taxpayers have no basis for judicial protection of their rights.

Taking into account the moratorium on inspections introduced by the Federal Law No. 215-FL of July 20, 2020, an increase in disputes over taxes and obligatory payments to the budget is not expected in the next 4 months. From December 22, 2020, the period for the suspension of penalties was extended to May 1, 2021.

Picture 2. The number of arbitration cases by categories and their share in 2019 and 2020

Every second case is decided not in favor of the plaintiff

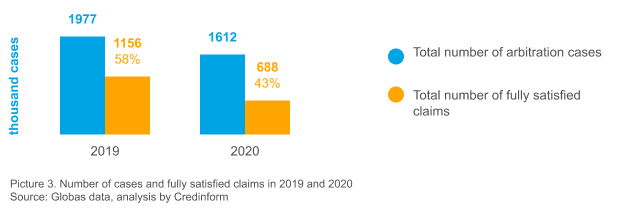
For the second year, there is a negative trend among the share of fully satisfied claims (Picture 3). In 2020, only 43% of the plaintiffs achieved full satisfaction of the claims, and only 9% of total amount of the asserted claims for 2020 were satisfied by the court. The main reason is the use of the arbitration court as an instrument of pressure on the counterparty. In most cases, the plaintiffs demonstrate the seriousness of intentions through the court, and thereby accelerate the voluntary process of debt recovery.

Picture 3. Number of cases and fully satisfied claims in 2019 and 2020 Source: Globas data, analysis by Credinform

Resume

The restriction of business activity influenced the decrease in the total number of arbitration cases and the number of fully satisfied claims in 2020.
Detailed counterparties check in the Information and Analytical system Globas is the most effective way to avoid economic disputes and losses.

Article
Trends in nonferrous metallurgy

Information agency Credinform has prepared a review of trends in nonferrous metallurgy.

The largest companies mining nonferrous ores (TOP-1000) in terms of annual revenue were selected for the analysis according to the data from the Statistical Register and the Federal Tax Service for the latest available periods (2014-2019). The analysis was based on the data of the Information and Analytical system Globas.

Net assets are total assets less total liabilities. This indicator reflects the real value of the property of an enterprise. When the company’s debt exceeds the value of its property, the indicator is considered negative (insufficiency of property).

The largest company in term of net assets is JSC POLYUS KRASNOYARSK, INN 2434000335, Krasnoyarsk territory. In 2019, net assets value of the company almost amounted to 313 billion RUB.

The lowest net assets value among TOP-1000 belonged to LLC KUZBASSARM, INN 4205201604, Kemerovo region – Kuzbass. The company is in process of being wound up since August 11, 2015. In 2019, insufficiency of property of the legal entity was indicated in negative value of -102 billion RUB.

Covering the six-year period, the average net assets values of TOP-1000 have a trend to increase with a decreasing growth rate (Picture 1).

Picture 1. Change in industry average net assets value in 2014 – 2019 Picture 1. Change in industry average net assets value in 2014 – 2019

Over the past six years, the share of companies with insufficient property had a negative trend to increase (Picture 2).

Picture 2. Shares of TOP-1000 companies with negative net assets value in 2014-2019 Picture 2. Shares of TOP-1000 companies with negative net assets value in 2014-2019

Sales revenue
In 2019, the revenue volume of 3 largest companies of the industry was 36% of total TOP-1000 revenue (Picture 3). This is indicative of relatively high level of aggregation of capital in the industry.

Picture 3. The share of TOP-10 companies in total 2019 revenue of TOP-1000 Picture 3. The share of TOP-10 companies in total 2019 revenue of TOP-1000

In general, there is a trend to increase in revenue with the decreasing growth rate (Picture 4).

Picture 4. Change in industry average net profit in 2014 – 2019 Picture 4. Change in industry average net profit in 2014 – 2019

Profit and loss
The largest organization in term of net profit is JSC POLYUS KRASNOYARSK, INN 2434000335, Krasnoyarsk territory. The company’s profit for 2019 almost reached 87 billion RUB.

Covering the six-year period, there is a trend to increase in average net profit with the decreasing growth rate (Picture 5).

Picture 5. Change in industry average net profit (loss) values in 2014 – 2019 Picture 5. Change in industry average net profit (loss) values in 2014 – 2019

For the six-year period, the average net profit values of TOP-50 have the increasing trend with the decreasing net loss (Picture 6).

Picture 6. Change in average net profit and net loss of ТОP-1000 in 2014 – 2019 Picture 6. Change in average net profit and net loss of ТОP-1000 in 2014 – 2019

Key financial ratios
Covering the six-year period, the average values of the current liquidity ratio were above the recommended one - from 1,0 to 2,0 with a trend to increase (Picture 7).

Current liquidity ratio (current assets to short-term liabilities) shows the sufficiency of company’s assets to repay on short-term liabilities.

Picture 7. Change in industry average values of current liquidity ratio in 2014 – 2019 Picture 7. Change in industry average values of current liquidity ratio in 2014 – 2019

Covering the six-year period, the average values of ROI ratio have a trend to increase (Picture 8).

ROI ratio is calculated as net profit to sum of shareholders equity and long-term liabilities, and shows the return of equity involved in commercial activities and long-term borrowed funds.

Picture 8. Change in industry average values of ROI ratio in 2014 – 2019 Picture 8. Change in industry average values of ROI ratio in 2014 – 2019

Assets turnover ratio is the ratio of sales revenue and company’s average total assets for a period. It characterizes the effectiveness of using of all available resources, regardless the source of their attraction. The ratio shows how many times per year the full cycle of production and circulation is performed, generating the corresponding effect in the form of profit.

Covering the six-year period, business activity ratio demonstrated the increasing trend (Picture 9).

Picture 9. Change in average values of assets turnover ratio in 2014 – 2019 Picture 9. Change in average values of assets turnover ratio in 2014 – 2019

Small business
74% of the TOP-1000 companies are registered in the Register of small and medium-sized enterprises of the Federal Tax Service of the Russian Federation. Their share in total revenue of TOP-1000 is 7,6% that is almost 3 times less than the national average in 2018-2019 (Picture 10).

Picture 10. Shares of revenue of small and medium-sized enterprises in TOP-1000 Picture 10. Shares of revenue of small and medium-sized enterprises in TOP-1000

Main regions of activity
Companies of TOP-1000 are registered in 43 regions of Russia, and unequally located across the country in accordance with the geographic location of natural resources. Almost 45% of companies largest by revenue are located in Krasnoyarsk territory, Magadan region and the Republic of Sakha (Yakutia) (Picture 11).

Picture 11. Distribution of TOP-1000 revenue by regions of Russia Picture 11. Distribution of TOP-1000 revenue by regions of Russia

Financial position score
Assessment of the financial position of TOP-1000 companies shows that the majority of them have average financial position (Picture 12).

Picture 12. Distribution of TOP-1000 companies by financial position score Picture 12. Distribution of TOP-1000 companies by financial position score

Solvency index Globas
Most of TOP-1000 companies got Adequate / Weak index Globas. This fact shows their limited ability to meet their obligations fully (Picture 13).

Picture 13. Distribution of TOP-50 companies by solvency index Globas Picture 13. Distribution of TOP-50 companies by solvency index Globas

Conclusion
Complex assessment of activity of the companies mining nonferrous ores, taking into account the main indexes, financial ratios and indicators, demonstrates the prevalence of positive trends in 2014 - 2019 (Table 1).

Table 1. Positive and negative trends, evaluation factors
Trends and evaluation factors Relative share of factors, %
Dynamics of the average net assets value up10
Rate of growth (decrease) in the average size of net assets down-10
Increase (decrease) in the share of enterprises with negative values of net assets down-10
Level of competition / monopolization down-10
Dynamics of the average revenue up10
Rate of growth (decrease) in the average size of revenue down-10
Dynamics of the average profit (loss) up10
Rate of growth (decrease) in the average profit (loss) down-10
Growth / decline in average values of companies’ net profit up10
Growth / decline in average values of companies’ net loss up10
Increase / decrease in average values of total liquidity ratio up10
Increase / decrease in average values of return on investment ratio up10
Increase / decrease in average values of asset turnover ratio, times up10
Share of small and medium-sized businesses in terms of revenue being more than 22% down-10
Regional concentration down-5
Financial position (the largest share) up5
Solvency index Globas (the largest share) up5
Average value of relative share of factors up1,2

вверх positive trend (factor), вниз negative trend (factor)