
Order a report
Custom-made industry research, company ratings, competitor analysis


Companies with certificates of conformity
Information agency Credinform presents a ranking of the Russian manufacturing companies, declaring and certifying goods on conformity to requirements of the Russian technical regulations. Enterprises (TOP-10) with the largest annual revenue were selected for the ranking, according to the data from the Statistical Register and the Federal Tax Service for the latest available accounting periods (2017 - 2019). Then they were ranked by the product profitability ratio (Table 1). The selection and analysis were based on the data from the Information and Analytical system Globas.
Product profitability ratio is calculated as the relation of sales revenue to expenses from ordinary activity. Profitability in general indicates the economic efficiency of production. The analysis of product profitability makes it possible to conclude about the efficiency and expediency of release of goods.
There are no standard values for indicators of this group, because they vary strongly depending on the industry.
In order to get the most comprehensive and fair picture of the financial standing of an enterprise, it is necessary to pay attention to all the combination of financial indicators and ratios.
| Name, INN, region, type of activity | Revenue, million RUB | Net profit (loss), million RUB | Product profitability ratio, % | Solvency index Globas | |||
| 2018 | 2019 | 2018 | 2019 | 2018 | 2019 | ||
| 1 | 2 | 3 | 4 | 5 | 6 | 7 | 8 |
| JSC PIPELINE BENDS ИНН 7449044694 Chelyabinsk region Manufacture of tubes, pipes, hollow profiles and related fittings, of steel |
|
|
|
|
|
|
222 Высокий |
| ООО ОТИС ЛИФТ ИНН 7805223443 Moscow Manufacture of elevators |
|
|
|
|
|
|
215 Высокий |
| ООО ТЕХНОЛОГИЧЕСКАЯ КОМПАНИЯ ШЛЮМБЕРЖЕ ИНН 7709413265 Tyumen region Manufacture of devices, sensors, equipment and tools for measuring, control and testing |
|
|
|
|
|
|
209 Высокий |
| ООО НЕСТЛЕ КУБАНЬ ИНН 2353018969 Krasnodar territory Processing of tea and coffee |
|
|
|
|
|
н/д | 229 Высокий |
| ООО ПРОИЗВОДСТВЕННОЕ ОБЪЕДИНЕНИЕ ЕВРОЛИФТМАШ ИНН 5026015392 Moscow region Manufacture of elevators |
|
|
|
|
|
|
222 Высокий |
| ООО ПРОИЗВОДСТВЕННОЕ ОБЪЕДИНЕНИЕ НЛМ ИНН 5053045149 Moscow region Manufacture of elevators |
|
|
|
|
|
|
250 Высокий |
| НАО ЩЕРБИНСКИЙ ЛИФТОСТРОИТЕЛЬНЫЙ ЗАВОД ИНН 5051000880 Moscow Manufacture of elevators |
|
|
|
|
|
|
272 Высокий |
| ПАО КАРАЧАРОВСКИЙ МЕХАНИЧЕСКИЙ ЗАВОД ИНН 7721024057 Moscow Manufacture of elevators |
|
|
|
|
|
|
241 Высокий |
| НАО КОРПОРАЦИЯ ГЛОРИЯ ДЖИНС ИНН 6166034397 Rostov region Manufacture of other outerwear |
|
|
|
|
|
|
244 Высокий |
| ООО ЖУПИКОВ ИНН 6829004230 Tambov region Manufacture of salted, boiled, baked, smoked, dried and other meat |
|
|
|
|
|
|
206 Высокий |
| Average value for TOP-10 | |
|
|
|
|
|
|
![]() improvement compared to prior period,
improvement compared to prior period, ![]() decline compared to prior period
decline compared to prior period
Four companies improved their values in 2019.
All the TOP-10 companies got Strong /Medium index Globas. This fact shows their ability to meet their obligations fully and by the due date.
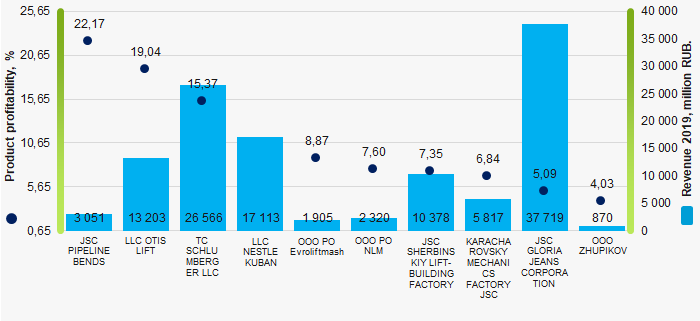 Picture 1. Product profitability ratio and revenue of the largest Russian manufacturing companies, declaring and certifying goods (TOP-10)