
Order a report
Custom-made industry research, company ratings, competitor analysis


Prohibition of housing and utilities sector debt recovery by third parties
Assignment of the right or demand on the collection of overdue debts on payment of residential premises and for utility services to third parties is prohibited in Russia from the moment of publication of the Federal Law №214-FZ dated 26.07.2019, which amended the Housing Code of the RF, the laws « On the protection of rights and legal interests of natural persons in cases of debts collection» and «On microfinance activities and microfinance organizations». This prohibition applies to credit organizations and companies engaged in overdue debts’ collection of natural persons.
Otherwise, the contract of assignment of the right or demand for debt recovery to third parties shall be considered as null and void.
Only landlords, management companies or other legal entities (sole entrepreneurs), who receive payments for residential premises and utility services in accordance with the Housing Code of the RF, have the right to enforce overdue debts on payment for residential premise and utility services.
It is possible to give up the right or demand for debt collection only based on an agreement with:
- newly selected management companies;
- established condominium associations, housing cooperatives or specialized consumer cooperatives;
- resource-supplying organizations;
- selected regional operators of municipal solid waste.
In addition, a provision has been enshrined that the owners of premises in multi-family housing must fulfill their obligations under multi-family housing management contracts by themselves, including payments for residential premises and utility services, and are not liable for obligations of other owners in the house.
According to the Information and Analytical system Globas, there are more than 67 000 active business entities for housing management in Russia. Information about them in full is available to subscribers of Globas.
Trends in activity of companies of Vladimir region
Information agency Credinform has prepared a review of activity trends of the largest companies of the real economy sector in Vladimir region.
The largest companies (ТОP-1000) in terms of annual revenue were selected according to the data from the Statistical Register for the latest available periods (2012 - 2017). The analysis was based on data of the Information and Analytical system Globas.
Net assets is a ratio reflecting the real value of company's property. It is calculated annually as the difference between assets on the enterprise balance and its debt obligations. The ratio is considered negative (insufficiency of property), if company’s debt exceeds the value of its property.
The largest company in terms of net assets is LLC VEROPHARM. In 2018 net assets of the company amounted to more than 31,5 billion RUB.
The smallest size of net assets in TOP-1000 had LLC ZONA REGULIRUEMOGO RAZVITIYA VTZ, which is in process of being wound up since 16.06.2017. The lack of property of the company in 2017 was expressed in negative terms -50,3 billion RUB.
For the last five years, the average values of TOP-1000 net assets showed the growing tendency (Picture 1).
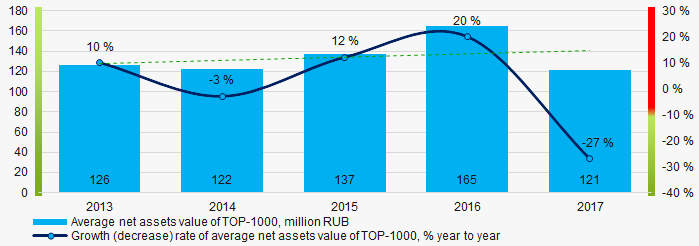 Picture 1. Change in average net assets value of ТОP-1000 companies in 2013 – 2017
 For the last five years, the share of ТОP-1000 enterprises with lack of property is reducing (Picture 2).
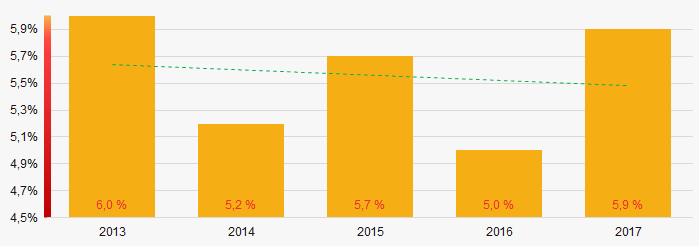 Picture 2. The share of enterprises with negative net assets value in ТОP-1000
Sales revenue
In 2017, the total revenue of 10 largest companies amounted to 38% from ТОP-1000 total revenue (Picture 3). This fact testifies the high level of industrial concentration in Vladimir region.
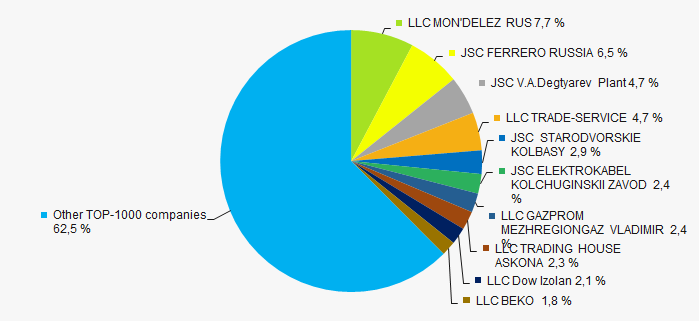 Picture 3. Shares of TOP-10 in TOP-1000 total revenue for 20171000
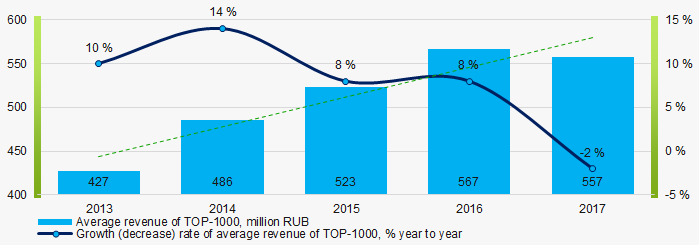 Picture 4. Change in average revenue of TOP-1000 in 2013 – 2017
Profit and loss
The largest company in terms of net profit is LLC MON'DELEZ RUS. In 2018 the company’s profit amounted to 4,1 billion RUB.
For the last five years, the average profit values of TOP-1000 show the downward trend (Picture 5).
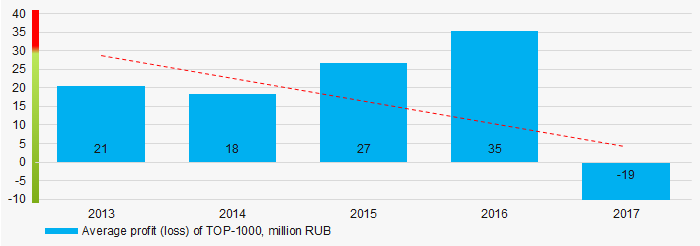 Picture 5. Change in average profit of TOP-1000 in 2013 – 2017
Over a five-year period, the average net profit values of ТОP-1000 show the growing tendency, along with this the average net loss is also growing (Picture 6).
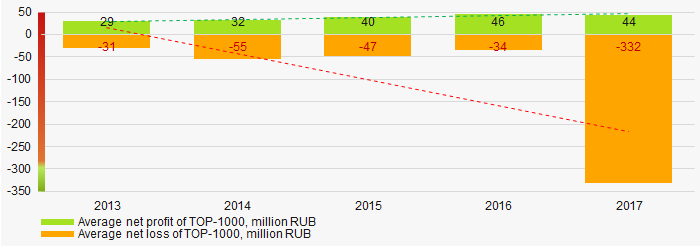 Picture 6. Change in average net profit/loss of ТОP-1000 companies in 2013 – 2017
Main financial ratios
For the last five years, the average values of the current liquidity ratio were higher than the recommended values - from 1,0 to 2,0, with growing tendency (Picture 7).
The current liquidity ratio (ratio of total working capital to short-term liabilities) shows the sufficiency of company’s assets to meet short-term obligations.
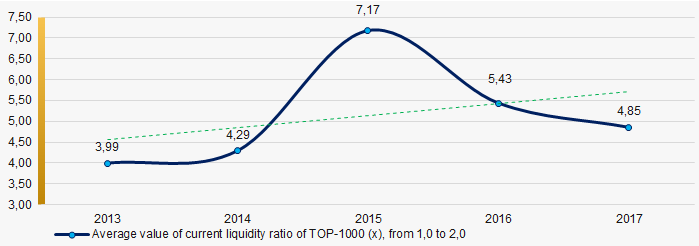 Picture 7. Change in average values of current liquidity ratio of TOP-1000 companies in 2013 – 2017
For the last five years, the high level of the average values of ROI ratio with downward trend is observed (Picture 8).
The ROI ratio is calculated as a ratio of net profit to sum of stockholder equity and long-term liabilities and shows the return from equity involved in commercial activities and long-term borrowed funds.
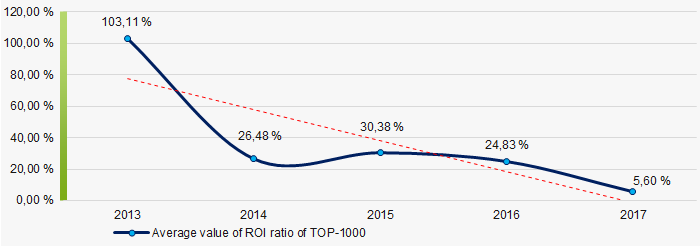 Picture 8. Change in average values of ROI ratio in 2013 – 2017
Assets turnover ratio is the ratio of sales revenue and company’s average total assets for a period. It characterizes the effectiveness of using of all available resources, regardless the source of their attraction. The ratio shows how many times per year the full cycle of production and circulation is performed, generating the corresponding effect in the form of profit.
For the last five years, this business activity ratio demonstrated the downward trend (Picture 9).
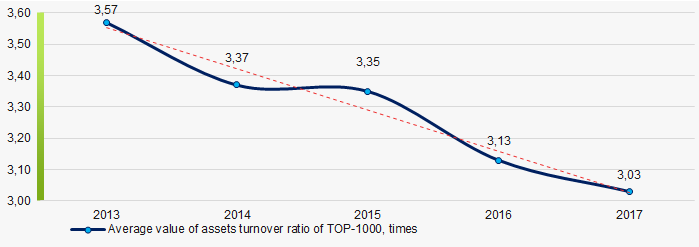 Picture 9. Change in average values of assets turnover ratio of TOP-1000 companies in 2013 – 2017
Small businesses
76% of ТОP-1000 companies are registered in the Unified register of small and medium-sized enterprises of the Russian Federal Tax Service. Herein, their share in TOP-1000 total revenue amounted to 22,7%, that is higher than the national average value (Picture 10).
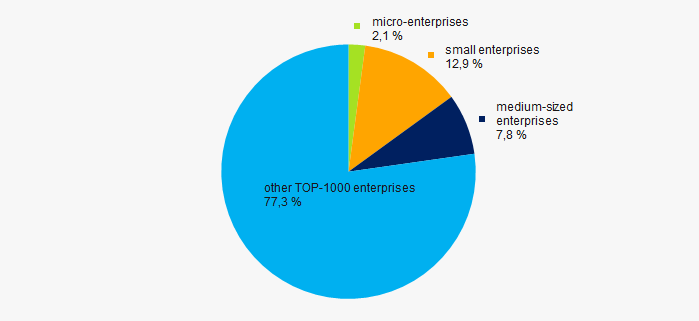 Picture 10. Shares of small and medium-sized enterprises in ТОP-1000
Main regions of activity
ТОP-1000 companies are unequally located across the country and registered in 18 regions of Russia. 62% of the largest enterprises in terms of revenue are located in the regional center – Vladimir, Kovrov and Petushki districts (Picture 11).
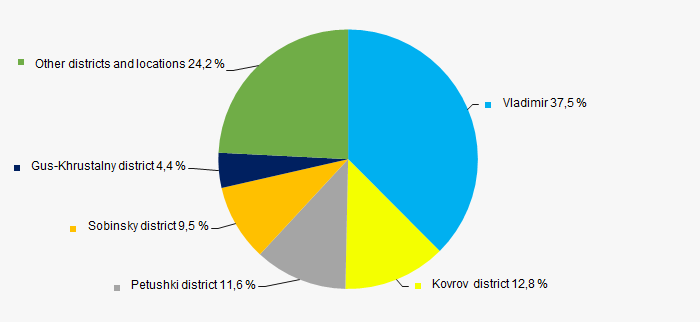 Picture 11. Distribution of TOP-1000 revenue by the districts of Vladimir region
Financial position score
An assessment of the financial position of TOP-1000 companies shows that the largest part have above average financial position (Picture 12).
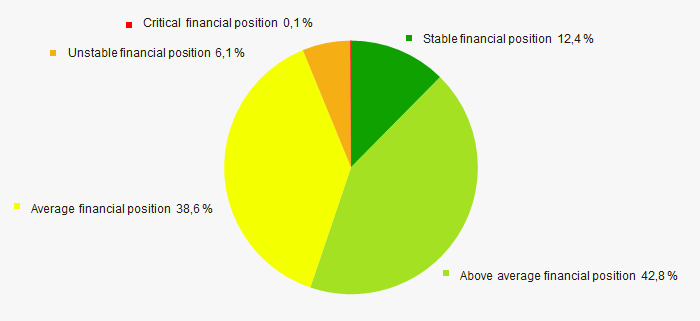 Picture 12. Distribution of TOP-1000 companies by financial position score
Solvency index Globas
Most of TOP-1000 companies got superior/high or strong/medium Solvency index Globas, this fact shows the ability of the companies to meet their obligations in time and fully (Picture 13).
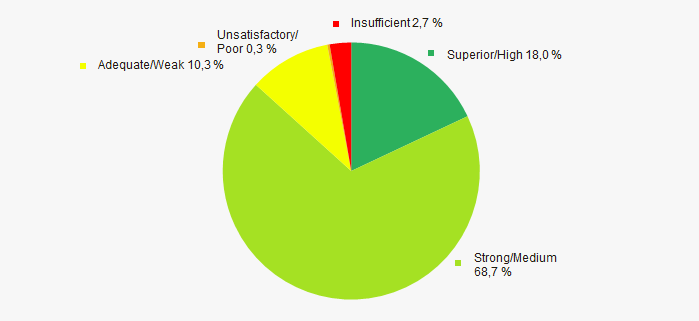 Picture 13. Distribution of TOP-1000 companies by Solvency index Globas
Industrial production index
According to the Federal Service of State Statistics, there is an increasing trend in the industrial production index in Vladimir region during 12 months of 2018 (Picture 14). Herewith the average index from month to month amounted to 100%.
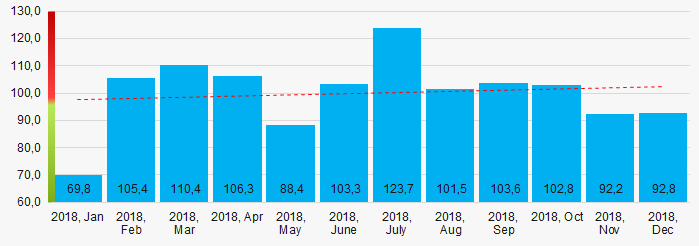 Picture 14. Industrial production index in Vladimir region in 2018-2019, month by month (%)
According to the same data, the share of enterprises of Vladimir region in the amount of revenue from the sale of goods, works, services made 0,408% countrywide in 2018 and 0,403% in the 1st quarter 2019, that is lower than in the 1st quarter 2018 (0,408%).
Conclusion
A complex assessment of activity of the largest companies of Vladimir region real economy, taking into account the main indexes, financial ratios and indicators, demonstrates the presence of positive trends (Table 1).
| Trends and assessment factors | Relative share, % |
| Growth/drawdown rate of average net assets value | |
| Increase / decrease in the share of enterprises with negative net assets | |
| The level of capital concentration | |
| Growth/drawdown rate of average revenue | |
| Growth/drawdown rate of average net profit (loss) | |
| Increase / decrease in average net profit of companies | |
| Increase / decrease in average net loss of companies | |
| Increase / decrease in average values of current liquidity ratio | |
| Increase / decrease in average values of ROI ratio | |
| Increase / decrease in average values of assets turnover ratio, times | |
| Share of small and medium-sized businesses by revenue more than 22% | |
| Regional concentration | |
| Financial position (the largest share) | |
| Solvency index Globas (the largest share) | |
| Industrial production index | |
| Dynamics of the share of enterprises in the total amount of revenue from the sale of goods, works, services countrywide | |
| Average value of factors | |
![]() favorable trend (factor),
favorable trend (factor), ![]() unfavorable trend (factor).
unfavorable trend (factor).