
Order a report
Custom-made industry research, company ratings, competitor analysis


Activity trends of Orenburg companies
Information Agency Credinform presents a review of activity trends of the largest real economy companies from the Orenburg region.
Orenburg companies with the largest annual revenue (TOP-1000) have been selected for the analysis, according to the data from the Statistical Register for the latest available accounting periods (2012 — 2017). The analysis was based on the data from the Information and Analytical system Globas.
Net asset value indicates fair value of corporate assets and is calculated annually as assets on balance less company’s liabilities. Net asset value is negative (insufficiency of property) if liabilities are larger than the property value.
| No. in TOP-1000, Name, INN, activity | Net asset value, billion RUB | Solvency index Globas | ||||
| 2013 | 2014 | 2015 | 2016 | 2017 | ||
| 1 | 2 | 3 | 4 | 5 | 6 | 7 |
| 1 ORENBURGNEFT JSC INN 5612002469 Extraction of crude petroleum In process of reorganization in the form of acquisition of other legal entities, 26.03.2019 |
|
|
|
|
|
226 Strong |
| 2 GAZPROM DOBYCHA ORENBURG LLC INN 5610058025 Extraction of natural gas and gas condensate |
|
|
|
|
|
236 Strong |
| 3 URAL STEEL JSC INN 5607019523 Manufacture of crude iron, ferroalloy, steel |
|
|
|
|
|
225 Strong |
| 4 GAI MINING AND PROCESSING CO JSC INN 5604000700 Mining and dressing of copper ores |
|
|
|
|
|
252 Medium |
| 5 GAZPROM NEFT ORENBURG LLC INN 5610218014 Extraction of crude petroleum |
|
|
|
|
|
311 Adequate |
| 996 LLC Named After 11 KAVDIVISION INN 5638027411 Mixed farming A bankruptcy claim was filed against the company |
|
|
|
|
|
400 Weak |
| 997 ORSKII VAGONNYI ZAVOD LLC INN 5614023224 Manufacture of railway locomotives and rolling stock Process of being wound up, 26.06.2017 |
|
|
|
|
|
600 Insufficient |
| 998 AGROFIRMA KRASNOKHOLMSKAYA LLC INN 5609044589 Growing of cereals A bankruptcy claim was filed against the company |
|
|
|
|
|
450 Unsatisfactory |
| 999 SOUTH URAL MINING AND PROCESSING COMPANY LLC INN 5607015014 Manufacture of cement |
|
|
|
|
|
297 Medium |
| 1000 ORENBURG AIRLINES JSC INN 5638057840 Non-scheduled passenger air transportation Process of being wound up, 23.06.2017 |
|
|
|
|
|
600 Insufficient |
![]() — growth compared to prior period,
— growth compared to prior period, ![]() — decline compared to prior period.
— decline compared to prior period.
Average net assets of TOP-1000 companies tended to increase during the last 5 years (Picture 1).
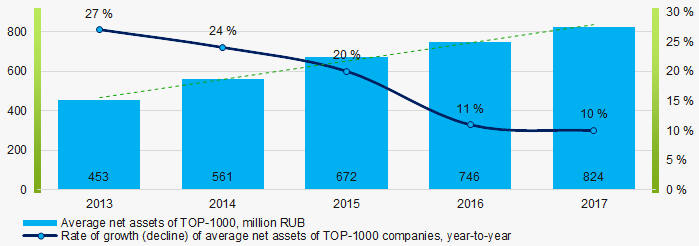 Picture 1. Change in average net assets of TOP-1000 companies in 2013 – 2017
The share of TOP-1000 companies with insufficiency of property tends to increase within the last 5 years (Picture 2).
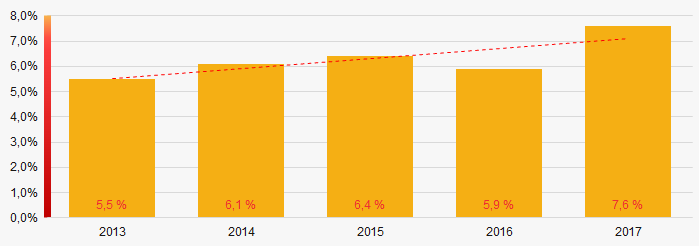 Picture 2. Share of TOP-1000 companies with negative value of net assets
 Sales revenue
In 2017 sales revenue of 10 industry leaders in the region amounted to 62% of total revenue of TOP-1000 companies (Picture 3). This is an indicator of a high level of industrial concentration in the Orenburg region.
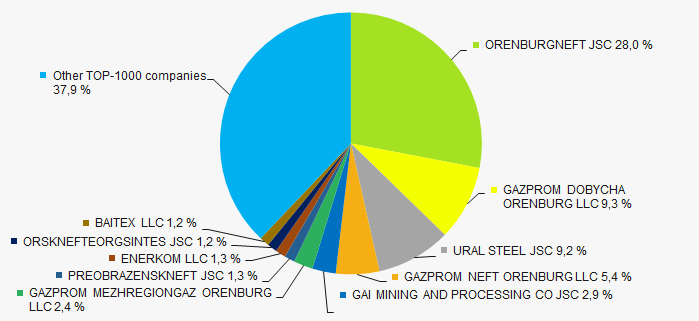 Picture 3. TOP-10 companies by their share in 2017 total revenue of TOP-1000 companies
In general, average industry revenue tends to increase (Picture 4).
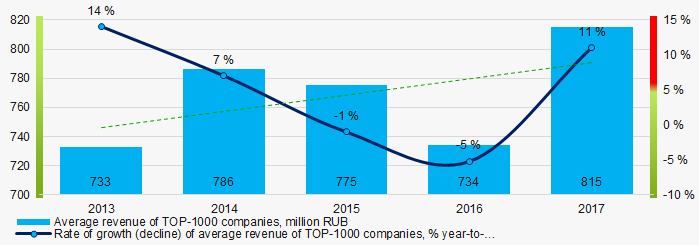 Picture 4. Change of average industry revenue of TOP-1000 companies in 2013 – 2017
Profit and loss
In 2017 net profit of 10 regional industry leaders amounted to 83% of total net profit of TOP-1000 companies (Picture 5).
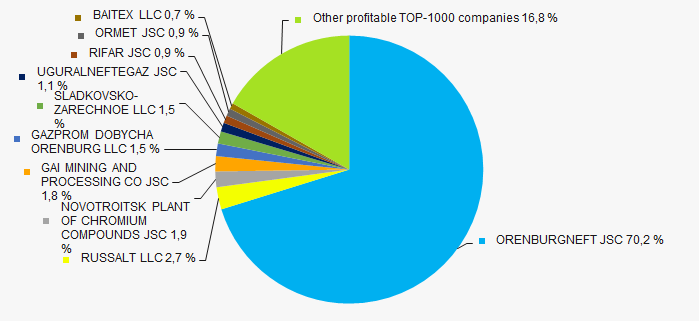 Picture 5. TOP-10 companies by their share in 2017 total net profit of TOP-1000
 In general, during the 5 years average industry profit of TOP-1000 companies tended to decrease (Picture 6).
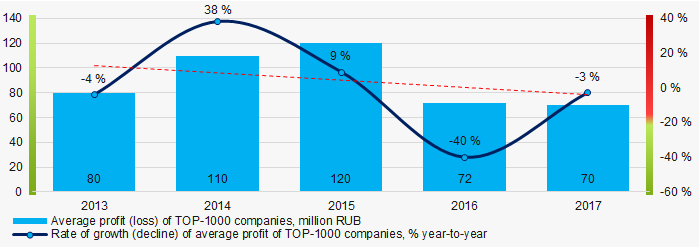 Picture 6. Change in average profit of TOP-1000 companies in 2013 — 2017
 During the last 5 years average industry net profit of TOP-1000 companies decreased, and the average net loss increased (Picture 7).
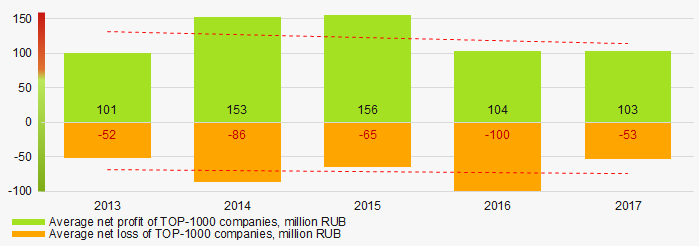 Picture 7. Change in average net profit and loss of TOP-1000 companies in 2013 — 2017
Key financial ratios
During the last 5 years average values of total liquidity ratio of TOP-1000 companies were above the recommended value — from 1,0 to 2,0, tending to increase (Picture 8).
Total liquidity ratio (a ratio of current assets to current liabilities) reveals the sufficiency of a company’s funds for meeting its short-term liabilities.
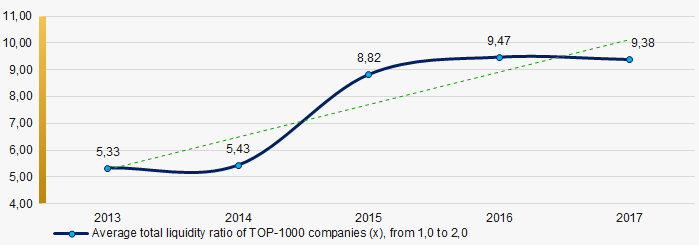 Picture 8. Change in average values of total liquidity ratio of TOP-1000 companies in 2013 — 2017
During the last decade, average industry values of return on investment ratio was relatively high, tending to decrease (Picture 9).
It is a ratio of net profit to total equity and noncurrent liabilities, and it demonstrates benefit from equity engaged in business activity and long-term raised funds of the company.
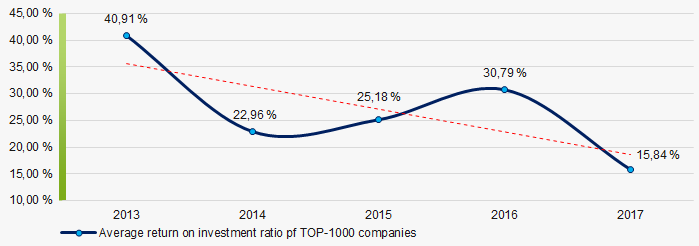 Picture 9. Change in average values of return on investment ratio of TOP-1000 companies in 2013 — 2017
Assets turnover ratio is a ratio of sales revenue to average total assets for the period, and it measures resource efficiency regardless of the sources. The ratio indicates the number of profit-bearing complete production and distribution cycles per annum.
During the last 5 years, this activity ratio tended to decrease (Picture 10).
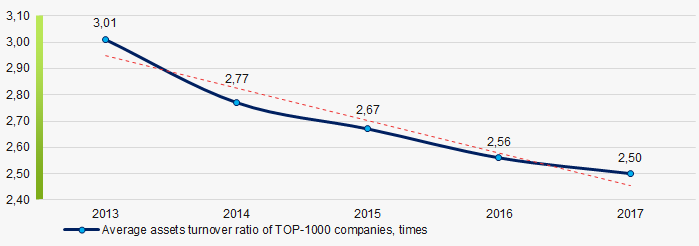 Picture 10. Change in average values of assets turnover ratio of TOP-1000 companies in 2013 — 2017
Structure of production and services
Crude petroleum and gas extraction enterprises and metal producers have the largest shares in total revenue of TOP-1000 companies (Picture 11).
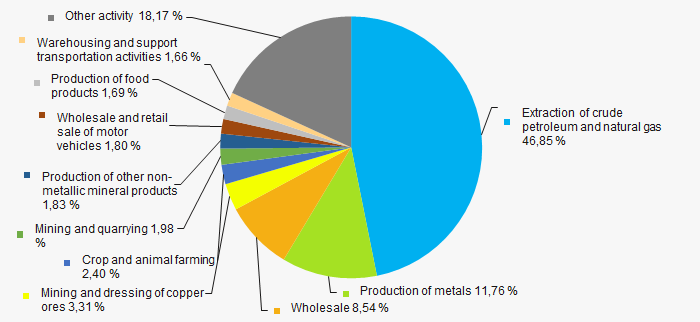 Picture 11. Types of activity by their share in total revenue of TOP-1000 companies
78% of TOP-1000 companies are included in the Register of small and medium-sized businesses of the Federal Tax Service of the Russian Federation. Their share in total revenue of TOP-1000 amounted to 16% that is lower than on national level (Picture 12).
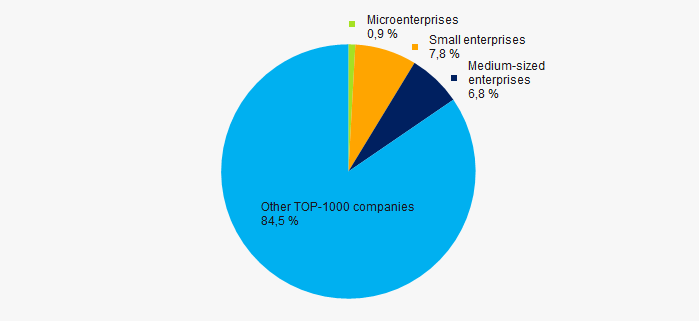 Picture 12. Shares of small and medium-sized enterprises in TOP-1000 companies' revenue, %
Key regions of activity
TOP-1000 companies are registered in 39 districts and settlements of the region and are unevenly located throughout its territory. 68% of the largest enterprises by revenue are located in the regional center: Orenburg, Buzuluk and Buzuluk district (Picture 13).
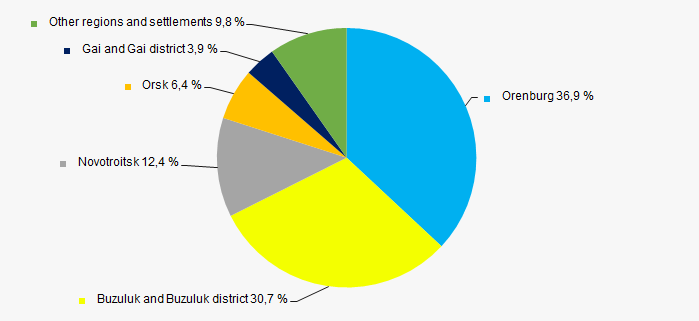 Picture 13. Revenue of TOP-1000 companies by districts of the Orenburg region
Financial position score
Assessment of financial state of TOP-1000 companies indicates that most of the companies have stable or above average financial position (Picture 14).
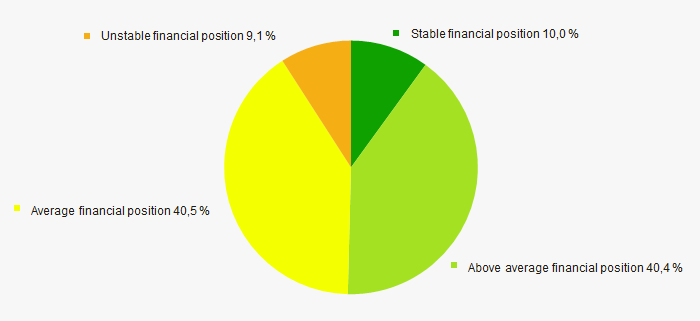 Picture 14. TOP-1000 companies by their financial position score
Solvency index Globas
The majority of TOP-1000 companies have got a superior, high, strong or medium Solvency index Globas, that indicates their capability to meet liabilities timely and in full (Picture 15).
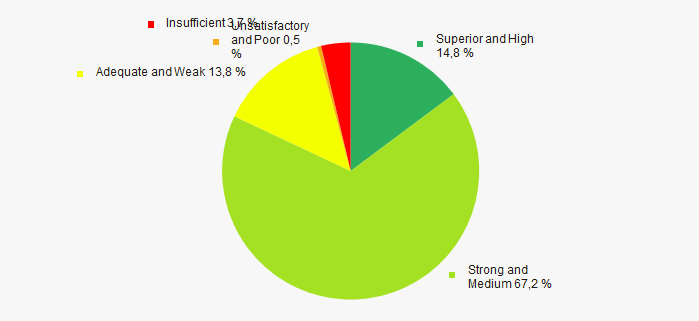 Picture 15. TOP-1000 companies by Solvency inde Globas
Index of industrial production
According to the Federal State Statistics Service, in 2018 the trend of increase in index of industrial production is observed in the Orenburg region (Picture 16). Average month-to-month index value is 98.3%
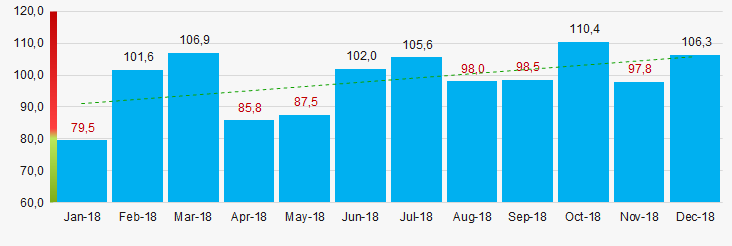 Picture 16. Index of industrial production in the Orenburg region in 2018, month-to-month (%)
According to the same data, the share of the Orenburg region in all-Russian revenue from sales of goods, products and services amounted to 0.66% for 2018.
Conclusion
A comprehensive assessment of the largest real economy companies of the Orenburg region, that considers key indexes, financial figures and ratios, is indicative of negative trends (Table 2).
| Trends and assessment factors | Relative share of the factor, % |
| Rate of growth (decline) of average net assets | |
| Increase/ Decrease of share of companies with negative net assets | |
| Level of concentration of capital | |
| Rate of growth (decline) of revenue | |
| Rate of growth (decline) of average net profit (loss) | |
| Increase/ Decrease of average net profit of companies | |
| Increase/ Decrease of average net loss of companies | |
| Increase/ Decrease of average total liquidity ratio | |
| Increase/ Decrease of average return on investment ratio | |
| Increase/ Decrease of average assets turnover ratio, times | |
| Share of small and medium-sized business within the region by revenue over 22% | |
| Regional concentration | |
| Financial standing (majority share) | |
| Solvency index Glogas (majority share) | |
| Index of industrial production | |
| Average factors' value | |
![]() — positive trend (factor),
— positive trend (factor), ![]() — negative trend (factor).
— negative trend (factor).