Globas is among the leaders of the ranking of the Russian information and analytical systems
The first ranking of information and analytical systems for checking counterparties by RAEX analytics includes 21 systems.
Tools, data completeness and other options for checking counterparties, due diligence, and macroeconomic analysis were assessed according to 18 criteria.
The experts of three main sectors were involved in the assessment: business analysts, financial experts and journalists.
Business analysts mark easy integration of data from the system with corporate ERP or CRM. In Globas.API new-generation tools for databulk prompt and proper analysis are applied.
Experts of the financial sector give priority to relevance and completeness of data. Using official sources, Globas provides reliable information and analyzes it with indexes. High-class analysis accuracy is possible due to constantly updating indexes.
Journalists draw attention to ease of use of the system, and options to create links and identify beneficiaries. Globas shows intermediate and beneficial owners, including foreign shareholders, as well as cross-border shareholders and their direct and indirect shares.
| № | System | Rating number | Completeness | Service | Acknowledgment | Expert opinion | Cost |
| 1 | SPARK-Interfax | 85,06 | 5,00 | 5,00 | 5,00 | 4,70 | 0,00 |
| 2 | Globas | 59,02 | 3,80 | 3,10 | 1,10 | 5,00 | 0,60 |
| 3 | BIR Analitik | 58,89 | 3,30 | 3,70 | 3,50 | 3,10 | 0,00 |
| 4 | SBIS | 53,93 | 2,00 | 3,00 | 5,00 | 2,80 | 4,40 |
| 5 | Kontur.Focus | 53,77 | 2,80 | 3,60 | 3,40 | 2,20 | 1,60 |
| 6 | Seldon.Basis | 53,61 | 3,20 | 2,50 | 4,40 | 2,20 | 1,40 |
| 7 | Delta Security | 48,29 | 3,50 | 4,20 | 0,00 | 0,80 | 1,80 |
| 8 | Kommersant Kartoteka | 46,22 | 2,70 | 1,80 | 3,50 | 1,70 | 4,40 |
| 9 | Integrum.Companies | 46,21 | 3,10 | 2,40 | 2,20 | 1,90 | 1,60 |
| 10 | HonestBusiness | 37,61 | 0,90 | 2,20 | 4,00 | 1,80 | 5,00 |
| 11 | CaseBook | 37,04 | 0,40 | 2,30 | 3,50 | 4,10 | 2,10 |
| 12 | Ruslana | 33,54 | 1,70 | 1,70 | 2,50 | 2,30 | 0,00 |
| 13 | Action.Checking counterparties | 32,37 | 1,30 | 1,10 | 3,90 | 1,50 | 3,90 |
| 14 | TASS Business | 32,12 | 1,50 | 1,40 | 1,50 | 2,40 | 4,20 |
| 15 | SKRIN | 31,87 | 1,40 | 1,00 | 2,80 | 2,40 | 2,60 |
| 16 | Prima Inform | 31,49 | 2,60 | 0,90 | 1,90 | 0,60 | 2,70 |
| 17 | FIRA | 31,10 | 1,40 | 1,30 | 1,20 | 3,80 | 1,40 |
| 18 | Moe Delo | 29,44 | 1,20 | 1,20 | 3,80 | 0,80 | 2,40 |
| 19 | Reputation | 26,30 | 1,30 | 1,30 | 1,10 | 2,10 | 2,00 |
| 20 | Lik:Expert | 24,35 | 0,90 | 1,40 | 1,30 | 2,00 | 2,30 |
| 20 | CREDITNET | 10,09 | 0,60 | 0,40 | 1,00 | 0,30 | 0,70 |
Sources: RAEX rating agency (“RAEX analytics”), 18.03.2020
Globas contains all tools for prompt and proper analysis of business partners. The system is used by business risk departments and compliance control services, economists, lawyers, marketing experts and analysts.
In 2020, we will continue to develop tools and add new sources to provide highest quality service.
Today, relevant and credible information is valuable more than ever.
TOP-1000 of Eastern Siberia companies
In order to reduce the interregional differences in the level and quality of life of the population, to accelerate economic growth and technological development and to ensure the national security of the country, in February 2019 Russian Government approved the Strategy of Spatial Development of the Russian Federation until 2025. It consists of 12 macro-regions; one of them is East Siberian macro-region, which includes Transbaikal region, Irkutsk region, Krasnoyarsk region, the Republic of Buryatia, Tuva and Khakassia Republic.
Information agency Credinform has prepared a review of activity trends of the largest companies of the real economy sector in East Siberian economic district of Russia. The largest companies (ТОP-1000) in terms of annual revenue were selected according to the data from the Statistical Register for the latest available periods (2013 - 2018). The analysis was based on data of the Information and Analytical system Globas.
Net assets is a ratio reflecting the real value of company's property. It is calculated annually as the difference between assets on the enterprise balance and its debt obligations. The ratio is considered negative (insufficiency of property), if company’s debt exceeds the value of its property
The largest company in terms of net assets is JSC Federal Hydro-Generating Company - RusHydro, INN 2460066195, Krasnoyarsk region. In 2018 net assets of the company amounted to 851 billion RUB.
The smallest size of net assets in TOP-1000 had JSC BOGUCHANSK ALUMINIUM SMELTER, INN 2465102746, Krasnoyarsk region. The lack of property of the company in 2018 was expressed in negative terms -41 billion RUB.
For the last five years, the average values of TOP-1000 net assets showed the growing tendency (Picture 1).
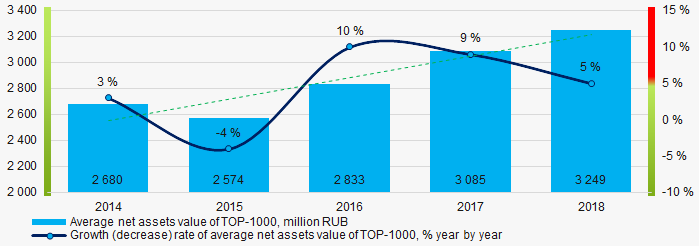 Picture 1. Change in average net assets value of ТОP-1000 companies in 2014 – 2018
For the last five years, the share of ТОP-1000 enterprises with lack of property is growing (Picture 2).
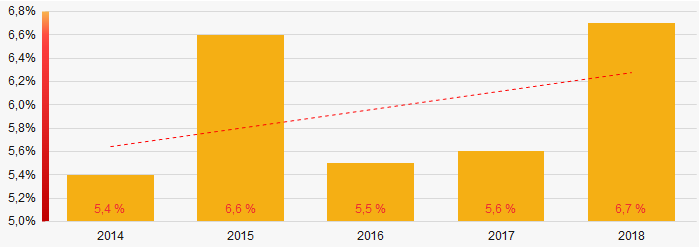 Picture 2. The share of enterprises with negative net assets value in ТОP-1000
Sales revenue
In 2018, the total revenue of 10 largest companies amounted to almost 45% om ТОP-1000 total revenue (Picture 3). This fact testifies the high level of capital concentration.
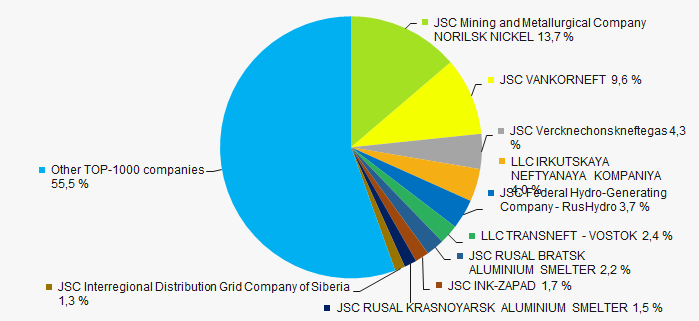 Picture 3. Shares of TOP-10 in TOP-1000 total revenue for 2018
In general, the growing trend in sales revenue is observed (Picture 4).
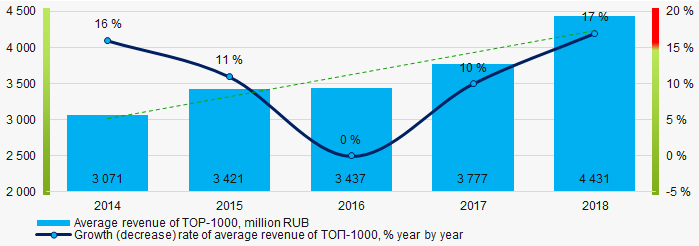 Picture 4. Change in average revenue of TOP-1000 in 2014 – 2018
 Profit and loss
The largest company in terms of net profit is JSC Mining and Metallurgical Company NORILSK NICKEL, INN 8401005730, Krasnoyarsk region. In 2018 the company’s profit amounted to 165 billion RUB.
For the last five years, the average profit values of TOP-1000 show the growing tendency (Picture 5).
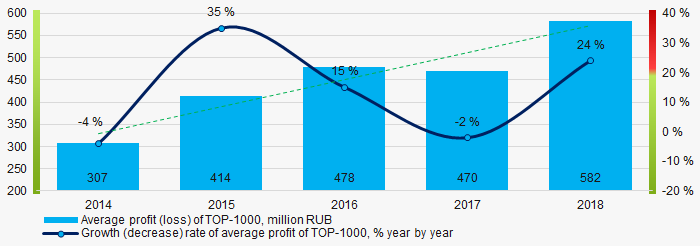 Picture 5. Change in average profit of TOP-1000 in 2014 – 2018
 Over a five-year period, the average net profit values of ТОP-1000 show the growing tendency, along with this the average net loss is decreasing (Picture 6).
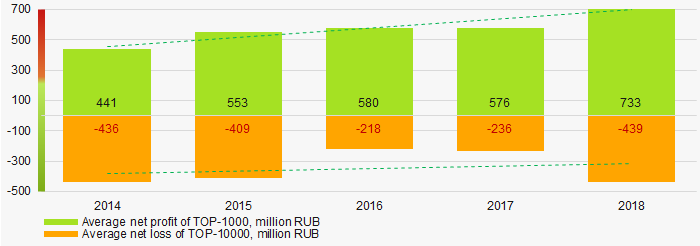 Picture 6. Change in average net profit/loss of ТОP-1000 companies in 2014 – 2018
 Main financial ratios
For the last five years, the average values of the current liquidity ratio were higher than the recommended values - from 1,0 to 2,0, with growing trend (Picture 7).
The current liquidity ratio (ratio of total working capital to short-term liabilities) shows the sufficiency of company’s assets to meet short-term obligations.
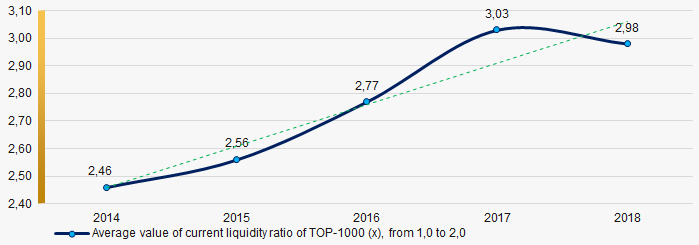 Picture 7. Change in average values of current liquidity ratio of TOP-1000 companies in 2014 – 2018
For the last three years, the high level of the average values of ROI ratio with growing trend is observed (Picture 8).
The ROI ratio is calculated as a ratio of net profit to sum of stockholder equity and long-term liabilities and shows the return from equity involved in commercial activities and long-term borrowed funds.
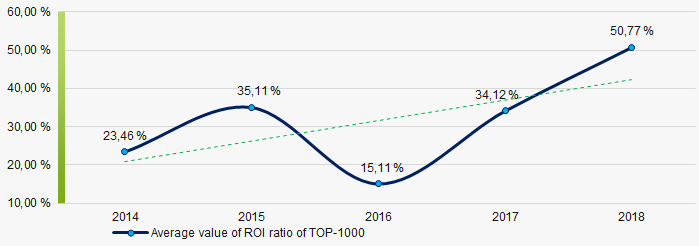 Picture 8. Change in average values of ROI ratio in 2014 – 2018
Assets turnover ratio is the ratio of sales revenue and company’s average total assets for a period. It characterizes the effectiveness of using of all available resources, regardless the source of their attraction. The ratio shows how many times per year the full cycle of production and circulation is performed, generating the corresponding effect in the form of profit.
For the last five years, this business activity ratio demonstrated the downward trend (Picture 9).
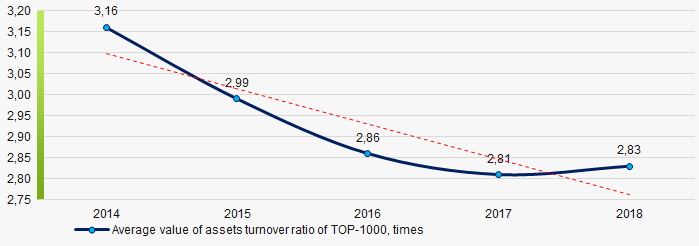 Picture 9. Change in average values of assets turnover ratio of TOP-1000 companies in 2014 – 2018
 Small businesses
49% of ТОP-1000 companies are registered in the Unified register of small and medium-sized enterprises of the Russian Federal Tax Service. Herein, their share in TOP-1000 total revenue is about 8%, which is significantly lower than the national average value (Picture 10).
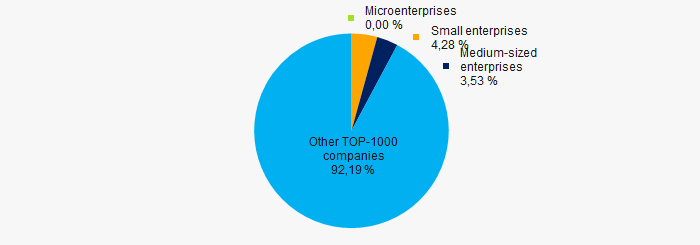 Picture 10. Shares of small and medium-sized enterprises in ТОP-1000
Main regions of activity
ТОP-1000 companies are unequally located across the country and registered in 6 regions of Russia. Almost 90% of the largest enterprises in terms of revenue are located in Krasnoyarsk and Irkutsk regions (Picture 11).
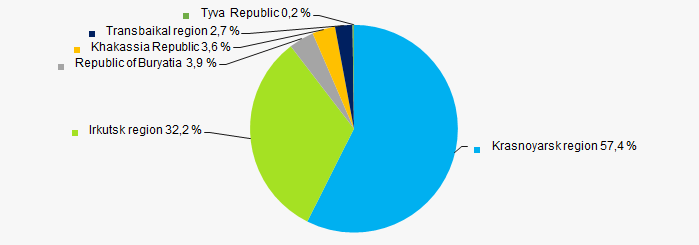 Picture 11. Distribution of TOP-1000 revenue over the territory of the East Siberian economic region of Russia
Financial position score
An assessment of the financial position of TOP-1000 companies shows that the largest part have above average financial position (Picture 12).
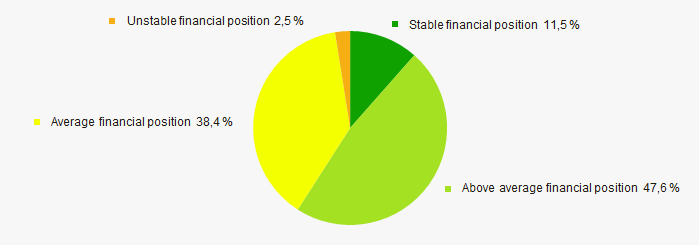 Picture 12. Distribution of TOP-1000 companies by financial position score
Solvency index Globas
Most of TOP-1000 companies got superior/high or strong/medium Solvency index Globas, this fact shows the ability of the companies to meet their obligations in time and fully (Picture 13).
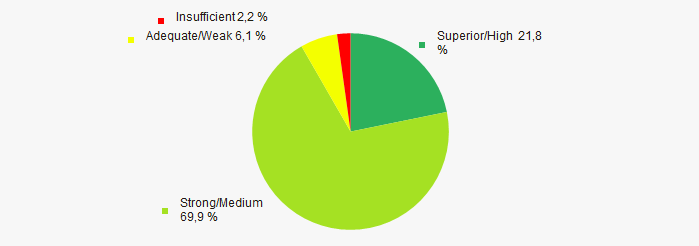 Picture 13. Distribution of TOP-1000 companies by Solvency index Globas
Industrial production index
According to the Federal Service of State Statistics, there is a downward trend in the industrial production index in East Siberian economic region of Russia during 12 months of 2019 – 2020 (Picture 14). Herewith the average index from month to month amounted to 101%.
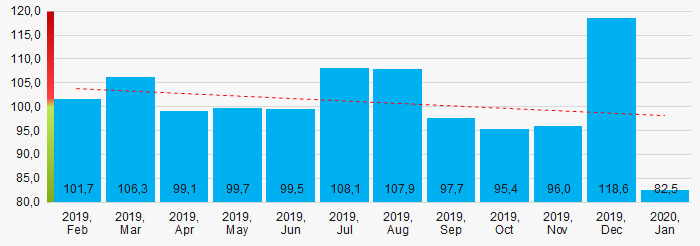 Picture 14. Average industrial production index in East Siberian economic region of Russia in 2019-2020, month by month (%)
According to the same data, the share of enterprises of East Siberian economic region of Russia in the amount of revenue from the sale of goods, works, services made 3,472% countrywide in 2019, that is higher than in 2018 (3,352%).
Conclusion
A complex assessment of activity of the largest companies of real economy sector in East Siberian economic district of Russia, taking into account the main indexes, financial ratios and indicators, demonstrates the presence of positive trends (Table 1).
| Trends and assessment factors | Relative share, % |
| Growth/drawdown rate of average net assets value |  10 10 |
| Increase / decrease in the share of enterprises with negative net assets |  -10 -10 |
| The level of competition / monopolization |  -10 -10 |
| Growth/drawdown rate of average revenue |  10 10 |
| Growth/drawdown rate of average net profit (loss) |  10 10 |
| Increase / decrease in average net profit of companies |  10 10 |
| Increase / decrease in average net loss of companies |  10 10 |
| Increase / decrease in average values of current liquidity ratio |  5 5 |
| Increase / decrease in average values of ROI ratio |  10 10 |
| Increase / decrease in average values of assets turnover ratio, times |  -10 -10 |
| Share of small and medium-sized businesses by revenue more than 22% |  -10 -10 |
| Regional concentration |  -10 -10 |
| Financial position (the largest share) |  10 10 |
| Solvency index Globas (the largest share) |  10 10 |
| Industrial production index |  -5 -5 |
| Dynamics of the share of enterprises in the total amount of revenue countrywide |  10 10 |
| Average value of factors |  2,5 2,5 |
 favorable trend (factor),
  unfavorable trend (factor).