Changes in legislation
The Federal Law of 12.11.2019 №375-FZ, introduced the amendments to the Federal Law of 02.10.2007 №229-FZ «On enforcement proceedings». In particular, article 24 of this law provides the possibility of legally relevant notification of parties to enforcement proceedings through the personal account on the official internet portal of the Public services starting from January 1st, 2020. Our publication of 09.12.2019 is dedicated to these amendments.
Starting from June 1st, the Federal Bailiffs Service launched the corresponding full format service on the portal of the Public services in order to fulfil these amendments. Information on progress of the enforcement proceedings is already available for citizens. Starting from September 1st, the access for the legal entities will be opened through the personal account.
The results of rendering the public services are:
- addressing the applicant the information on enforcement proceedings in execution in regard to private person or legal entity;
- addressing the applicant the notification on availability or absence of enforcement proceeding in execution.
The reasons for rejection in public service delivery are not provided by the Russian legislation.
The service is performed within 17 working days.
The online data on all enforcement proceedings in regard to legal entities starting from January 2012 is entirely available to the subscribers of the Information and Analytical system Globas.
Trends in Ekaterinburg economy in time of crisis
Information agency Credinform has prepared a review of activity trends of the largest companies of Ekaterinburg real economy sector during the financial crisis of 2008-2009.
The largest companies (ТОP-1000) in terms of annual revenue were selected according to the data from the Statistical Register for the latest available periods (2006 - 2011). The analysis was based on data of the Information and Analytical system Globas.
Number of active companies
Within 2006 - 2011 the number of active companies was growing, however during the acute phase of crisis, the growth rate was decreasing.
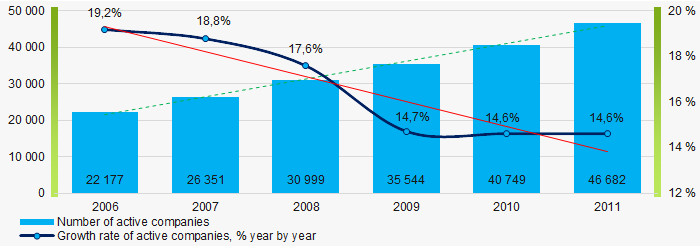 Picture 1. Dynamics of active companies in 2006 – 2011
Net assets is a ratio reflecting the real value of company's property. It is calculated annually as the difference between assets on the enterprise balance and its debt obligations. The ratio is considered negative (insufficiency of property), if company’s debt exceeds the value of its property.
The largest company in terms of net assets was JSC Enel Russia, INN 6671156423. In 2011 net assets of the company amounted to almost 58 billion RUB. In 2019 the indicator amounted to 49 billion RUB.
The smallest size of net assets in TOP-1000 had JSC THE SVERDLOVSK SUBURBAN COMPANY, INN 6659122795. The lack of property of the company in 2011 was expressed in negative terms -1,4 billion RUB and – 2,9 billion RUB in 2019.
Within 2006-2011, the average values of TOP-1000 net assets showed the growing tendency, however the growth rate was decreasing during the acute phase of crisis in the beginning of recovery. (Picture 2).
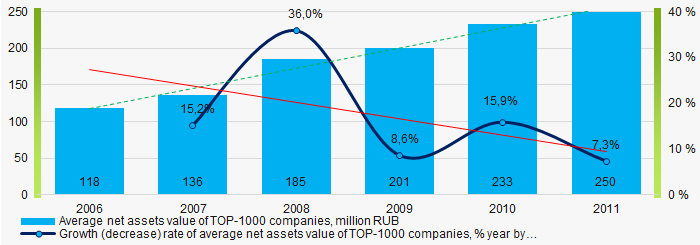 Picture 2. Change in average net assets value of ТОP-1000 companies in 2006– 2011
In general, within 2006 - 2011, the share of ТОP-1000 enterprises with lack of property was decreasing (Picture 3).
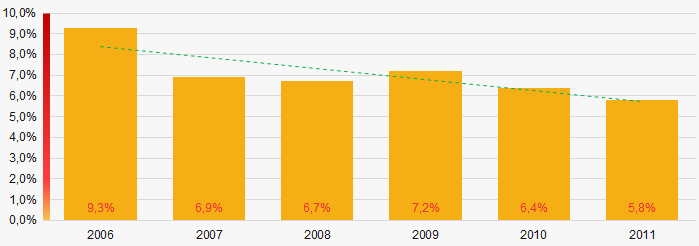 Picture 3. The share of enterprises with negative net assets value in ТОP-1000 in 2006 – 2011
 Sales revenue
The largest company by sales revenue was also JSC Enel Russia, INN 6671156423. In 2011 the indicator amounted to almost 61 billion RUB and almost 74 billion RUB in 2019.
In general, the growing trend in sales revenue with decreasing growth rate was observed (Picture 4).
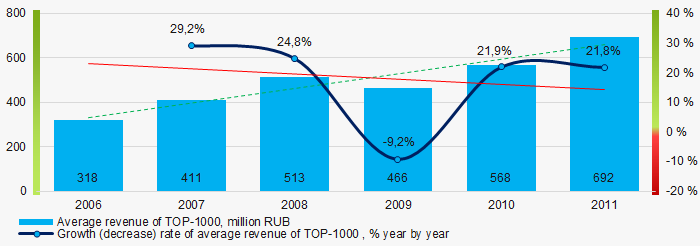 Picture 4. Change in average revenue of TOP-1000 in 2006 – 2011
Profit and loss
The largest company in terms of net profit was also JSC Enel Russia, INN 6671156423. In 2011, the company’s profit amounted to more than 3 billion RUB, in 2019 a loss of 12 billion RUB was recorded.
Within 2006 – 2011, the average profit values of TOP-1000 showed the growing tendency with decrease during the acute phase of crisis (Picture 5).
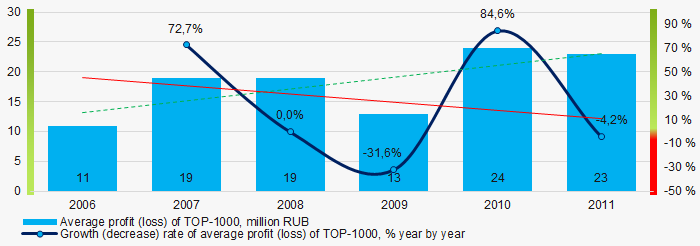 Picture 5. Change in average profit (loss) of TOP-1000 in 2006 – 2011
 In 2006 – 2011 the average net profit values of ТОP-1000 showed the growing tendency, along with this the average net loss was increasing, especially in the beginning of recovery (Picture 6).
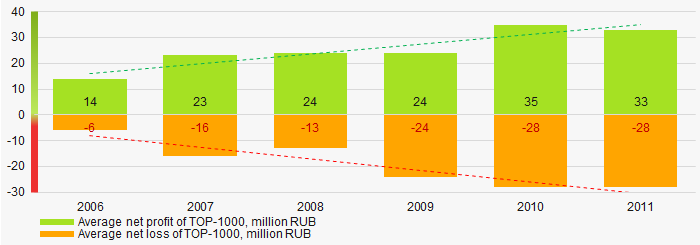 Picture 6. Change in average net profit/loss of ТОP-1000 in 2006 – 2011
Main financial ratios
In 2006 – 2011 the average values of the current liquidity ratio were higher than the recommended values - from 1,0 to 2,0, with growing trend in the beginning of recovery (Picture 7).
The current liquidity ratio (ratio of total working capital to short-term liabilities) shows the sufficiency of company’s assets to meet short-term obligations.
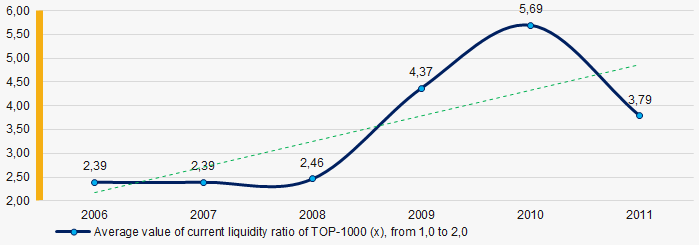 Picture 7. Change in average values of current liquidity ratio of TOP-1000 companies in 2006 – 2011
Within 2006 - 2011 the decreasing trend of the average values of ROI ratio with significant downward trend in 2009 was observed (Picture 8).
The ROI ratio is calculated as a ratio of net profit to sum of stockholder equity and long-term liabilities and shows the return from equity involved in commercial activities and long-term borrowed funds.
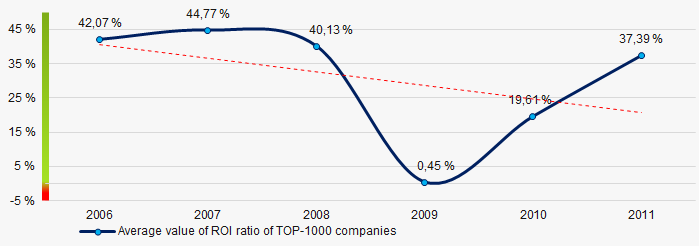 Picture 8. Change in average values of ROI ratio in 2006 – 2011
 Assets turnover ratio is the ratio of sales revenue and company’s average total assets for a period. It characterizes the effectiveness of using of all available resources, regardless the source of their attraction. The ratio shows how many times per year the full cycle of production and circulation is performed, generating the corresponding effect in the form of profit.
In 2006 – 2011 this business activity ratio demonstrated the decreasing trend (Picture 9).
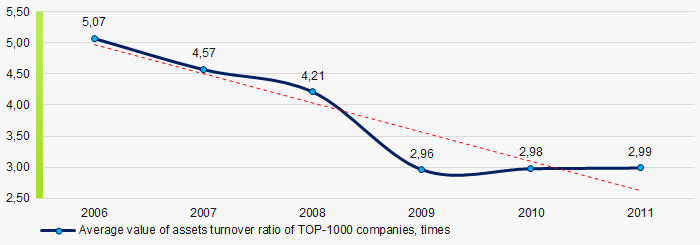 Picture 9. Change in average values of assets turnover ratio of TOP-1000 companies in 2006 – 2011
Small businesses
75% of ТОP-1000 companies are registered in the Unified register of small and medium-sized enterprises of the Russian Federal Tax Service. Herein, in 2011 their share in TOP-1000 total revenue amounted to 17% (Picture 10).
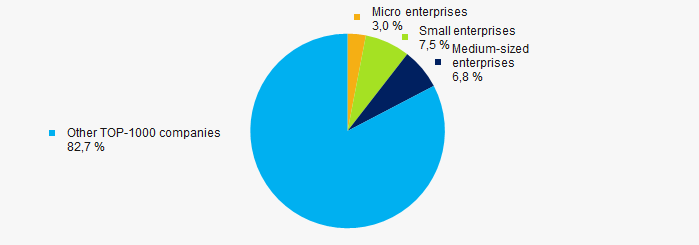 Picture 10. Revenue of small and medium-sized enterprises in 2011
Financial position score
An assessment of the financial position of TOP-1000 companies shows that in 2020 the largest part has the average financial position (Picture 11).
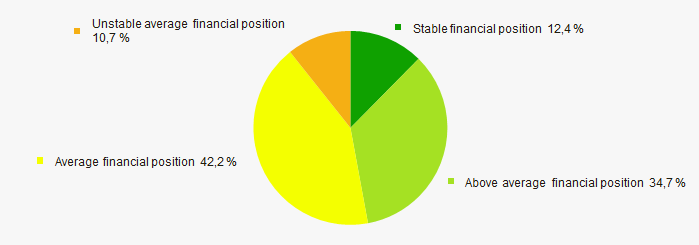 Picture 11. Distribution of TOP-1000 companies by financial position score in 2020
Solvency index Globas
In 2020 the most of TOP-1000 companies got superior/high or strong/medium Solvency index Globas, this fact shows the ability of the companies to meet their obligations in time and fully (Picture 12).
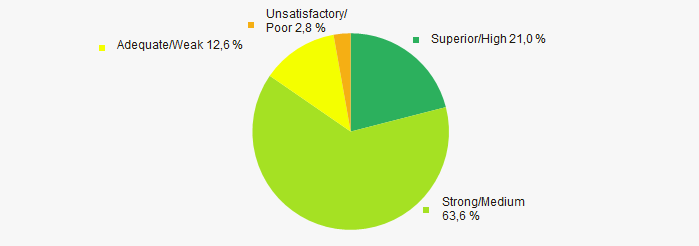 Picture 12. Distribution of TOP-1000 companies by Solvency index Globas in 2020
Conclusion
A complex assessment of activity of the largest Russian companies of Ekaterinburg real economy sector, taking into account the main indexes, financial ratios and indicators, demonstrates the balance of positive and negative trends within 2006-2011 (Table 1).
| Trends and assessment factors | Relative share, % | Possible forecast |
| Dynamics of active companies |  10 10 |
|
| Growth rate of active companies |  -10 -10 |
During the acute phase of crisis, the number of active companies may decrease |
| Dynamics of average net assets value |  10 10 |
|
| Growth/drawdown rate of average net assets value |  -10 -10 |
During the acute phase of crisis, the growth rate of average net assets may decrease |
| Increase / decrease in the share of enterprises with negative net assets |  10 10 |
|
| Dynamics of average revenue |  10 10 |
|
| Growth/drawdown rate of average revenue |  -10 -10 |
During the acute phase of crisis, the growth rate of revenue may decrease |
| Dynamics of average profit |  10 10 |
|
| Growth/drawdown rate of average net profit (loss) |  -10 -10 |
During the acute phase of crisis the growth rate of average profit may decrease |
| Increase / decrease in average net profit of companies |  10 10 |
|
| Increase / decrease in average net loss of companies |  -10 -10 |
In time of crisis and its recovery the net loss may increase |
| Increase / decrease in average values of current liquidity ratio |  5 5 |
|
| Increase / decrease in average values of ROI ratio |  -10 -10 |
In time of crisis, the ROI ratio may decrease |
| Increase / decrease in average values of assets turnover ratio, times |  -10 -10 |
In time of crisis, the business activity is declining and during the recovery - is slowly growing |
| Share of small and medium-sized businesses by revenue more than 20% |  -10 -10 |
|
| Financial position (the largest share) |  5 5 |
|
| Solvency index Globas (the largest share) |  10 10 |
|
| Average value of factors |  0,0 0,0 |
 favorable trend (factor),
  unfavorable trend (factor).