
Order a report
Custom-made industry research, company ratings, competitor analysis


Trends in metallurgy
Information agency Credinform has prepared a review of trends in activity of the largest Russian iron and steel companies. The largest enterprises (TOP-10 and TOP-1000) in terms of annual revenue were selected according to the data from the Statistical Register for the latest available periods (2014-2017). The analysis was based on data of the Information and Analytical system Globas.
Net assets is a ratio reflecting the real value of company's property. It is calculated annually as the difference between assets on the enterprise balance and its debt obligations. The ratio is considered negative (insufficiency of property), if company’s debt exceeds the value of its property.
| № | Name, INN,activity, region | Net assets value, bln RUB | Solvency index Globas | |||
| 2014 | 2015 | 2016 | 2017 | |||
| 1 | 2 | 3 | 4 | 5 | 6 | 7 |
| 1 | JSC NOVOLIPETSK STEEL INN 4823006703 Lipetsk region Manufacture of cold-rolled steel sheet products |
314.7 | |
|
|
136 Superior |
| 2 | JSC MMC NORILSK NICKEL INN 8401005730 Krasnodar territory Manufacture of other non-ferrous metals |
267.0 | |
|
|
201 Strong |
| 3 | JSC MAGNITOGORSK IRON & STEEL WORKS INN 7414003633 Chelyabinsk region Manufacture of iron, steel and ferroalloys |
123.8 | |
|
|
159 Superior |
| 4 | JSC EVRAZ NIZHNY TAGIL METALLURGICAL PLANT INN 6623000680 Sverdlovsk region Manufacture of iron, steel and ferroalloys |
181.1 | |
|
|
138 Superior |
| 5 | JSC SEVERSTAL INN 3528000597 Vologda region Manufacture of iron, steel and ferroalloys |
125.2 | |
|
|
168 Superior |
| 996 | JSC UFALEYNICKEL INN 7402001769 Chelyabinsk region Manufacture of other non-ferrous metals In liquidation since 08.11.2017 |
5.4 | |
|
|
600 Insufficient |
| 997 | LLC CHEBOKSARY INDUSTRIAL FOUNDRY INN 2127318422 The Republic of Chuvashia Casting of steel |
-2.8 | |
|
|
356 Adequate |
| 998 | LLC UMMC-STEEL CORPORATION INN 6606021264 Sverdlovsk region Manufacture of high-quality hot-rolled products and wire rod |
-12.4 | |
|
|
317 Adequate |
| 999 | JSC BOGUCHANSK ALUMINIUM SMELTER INN 2465102746 Krasnoyarsk territory Manufacture of aluminum |
-20.8 | |
|
|
259 Strong |
| 1000 | JSC AMURMETAL INN 2703000858 Khabarovsk territory Manufacture of ingot steel In liquidation since 11.10.2013 |
-22.2 | |
|
|
600 Insufficient |
![]() — growth of indicator in comparison with prior period,
— growth of indicator in comparison with prior period, ![]() — decline of indicator in comparison with prior period.
— decline of indicator in comparison with prior period.
For the last 10 years, the average values of net assets showed the decreasing tendency (Picture 1).
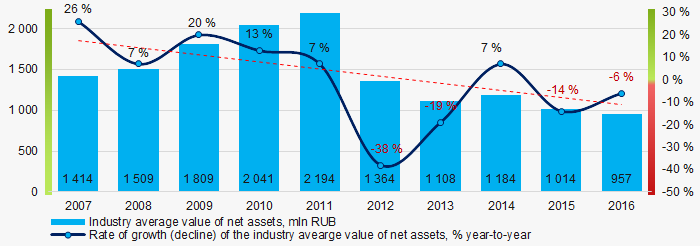 Picture 1. Change in average net assets value in 2007 – 2016
Despite the share of enterprises with insufficiency of property is high, it is decreasing over the past three years (Picture 2).
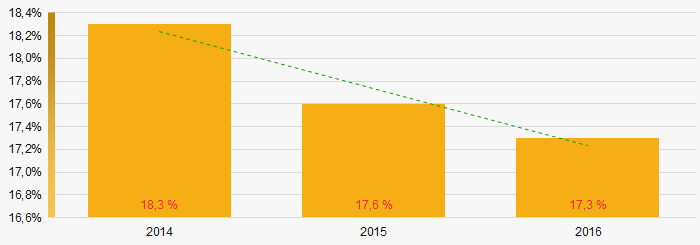 Picture 2. Share of enterprises with negative net assets value in TOP-1000
Sales revenue
In 2016 total revenue of 10 largest companies amounted to 52% from TOP-1000 total revenue (Picture 3). This fact testifies relatively high level of concentration of production within the industry.
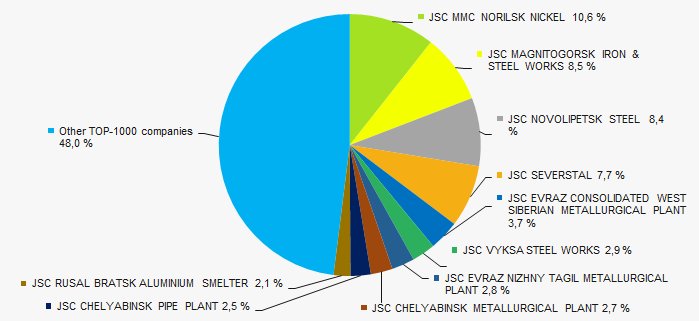 Picture 3. ДоShares of TOP-10 companies in TOP-1000 total profit for 2016
Trend to decrease in revenue is observed (Picture 4).
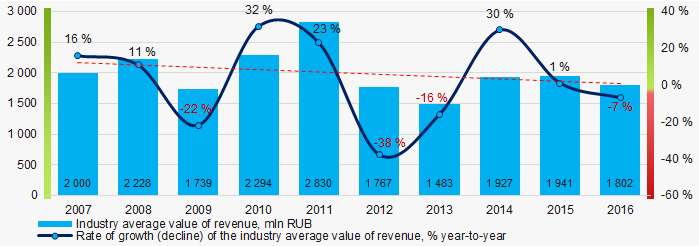 Picture 4. Change in average net profit in 2007-2016
Profit and loss
In 2016 profit of 10 largest companies amounted to 76% from TOP-1000 total profit (Picture 5).
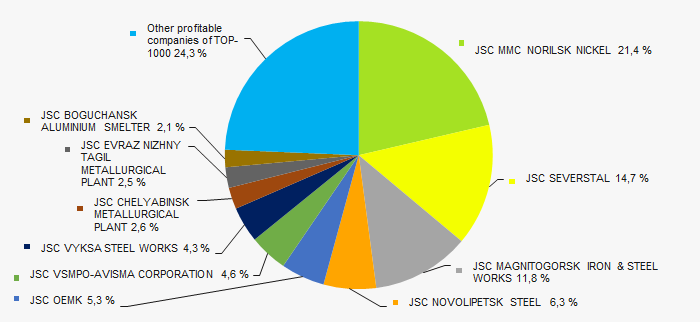 Picture 5. Shares of TOP-10 companies in TOP-1000 total profit for 2016
For the last ten years, the average industry net profit values show the decreasing tendency (Picture 6).
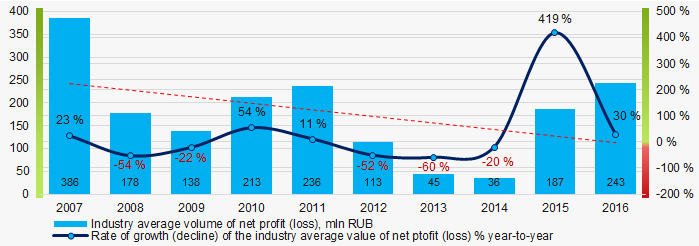 Picture 6. Change in average net profit (loss) in 2007-2016
For the three-year period, the average net profit values of TOP-1000 companies show the increasing tendency. At the same time, the average net loss also increases (Picture 7).
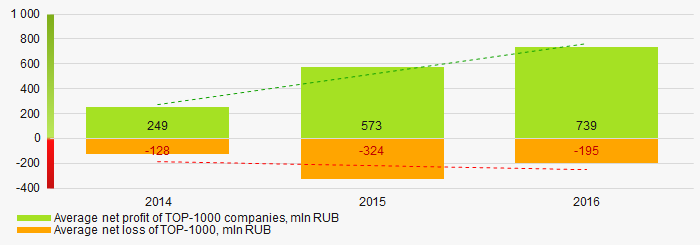 Picture 7. Change in average profit and loss of ТОP-1000 in 2014 – 2016
For the last ten years, the average values of the current liquidity ratio were within the recommended values - from 1,0 to 2,0 with a trend to decrease (Picture 8).
The current liquidity ratio (ratio of total working capital to short-term liabilities) shows the sufficiency of company’s assets to meet short-term obligations.
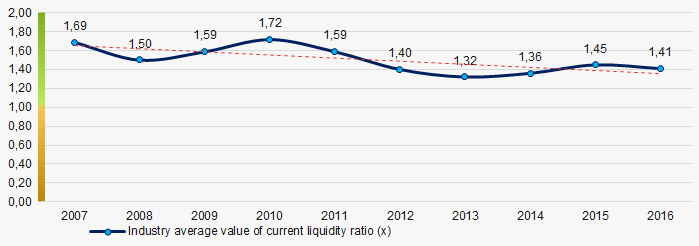 Picture 8. Change in average values of current liquidity ratio in 2007 – 2016
For the last ten years, the decreasing tendency of ROI ratio is observed (Picture 9).
The ROI ratio is calculated as a ratio of net profit to sum of stockholder equity and long-term liabilities and shows the return from equity involved in commercial activities and long-term borrowed funds.
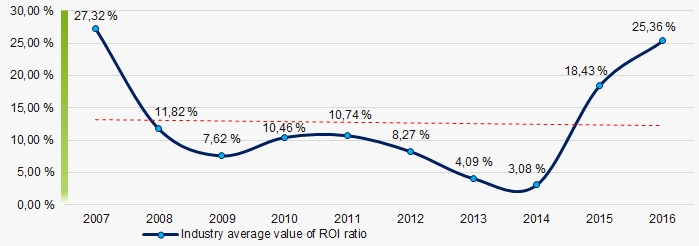 Picture 9. Change in average values of ROI ratio in 2007 – 2016
Assets turnover ratio is the ratio of sales revenue and company’s average total assets for a period. It characterizes the effectiveness of using of all available resources, regardless the source of their attraction. The ratio shows how many times per year the full cycle of production and circulation is performed, generating the corresponding effect in the form of profit.
For the last ten years, this business activity ratio demonstrated the downward trend (Picture 10).
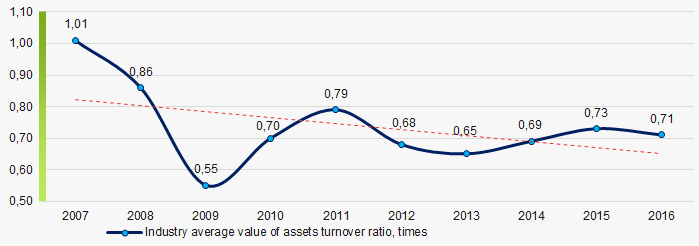 Picture 10. Change in average values of assets turnover ratio in 2007 – 2016
Production structure
The highest share in total revenue of TOP-1000 falls for companies engaged in manufacture of iron, steel and ferroalloys (Picture 11).
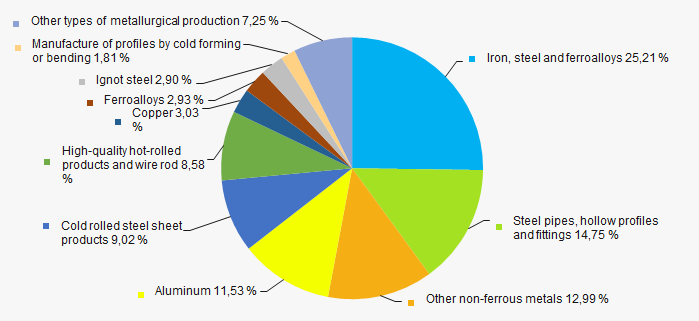 Picture 11. Distribution of activity types in total revenue of TOP-1000, %
70% companies of TOP-1000 are registered in the Register of small and medium-sized businesses of the Federal Tax Service of the Russian Federation (Picture 12).
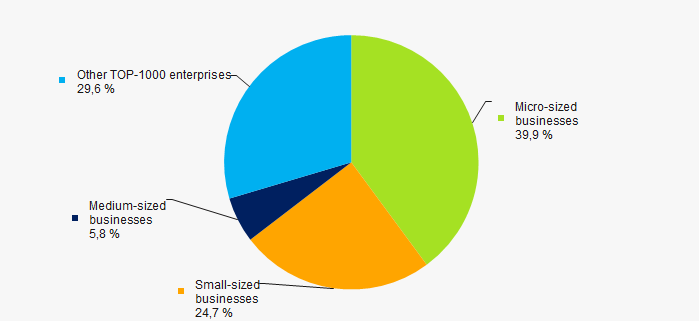 Picture 12. Shares of small and medium-sized enterprises in TOP-1000, %
Main regions of activity
Companies of TOP-1000 are unequally located across the country and registered in 74 regions of Russia. Companies largest by revenue are located in Chelyabinsk region (Picture 13).
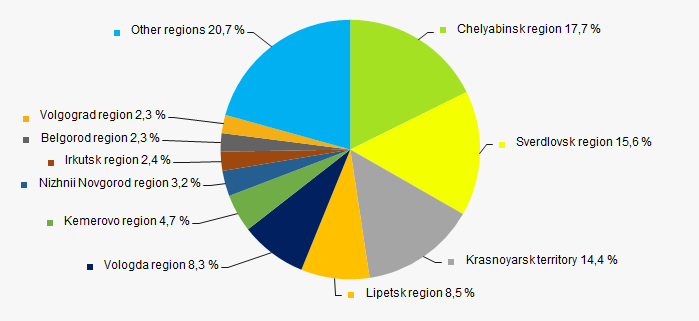 Picture 13. Distribution of TOP-1000 revenue by the regions of Russia
Financial position score
An assessment of the financial position of TOP-1000 companies shows that the majority of them have average financial position (Picture 14).
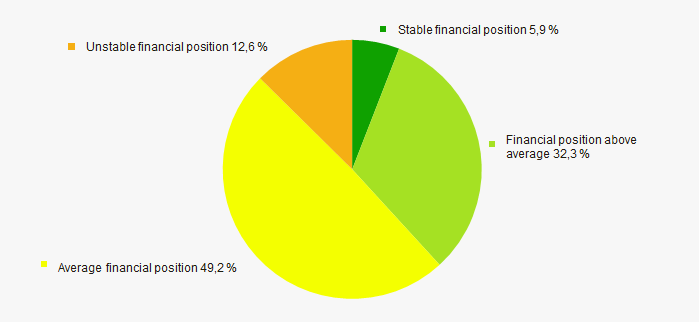 Picture 14. Distribution of TOP-1000 companies by financial position score
Solvency index Globas
Most of TOP-1000 companies got Superior/High or Strong/Medium Solvency index Globas, this fact shows the ability of the companies to meet their obligations in time and fully (Picture 15).
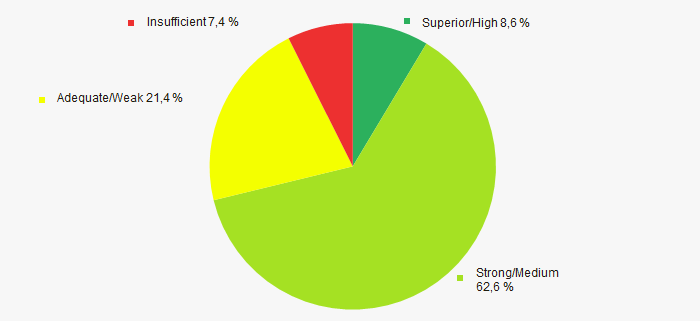 Picture 15.Distribution of TOP-1000 companies by solvency index Globas
Conclusion
A complex assessment of activity of the largest Russian iron and steel companies, taking into account the main indexes, financial ratios and indicators, demonstrates certain favorable trends and prevalence of negative factors, such as high concentration of production, reduction of net assets, revenue, net income and financial ratios.
According to the Federal State Statistics Service (Rosstat), in 2017 - 2018 the trend to some increase in indexes of industrial production in metallurgy is observed (Picture 16). Manufacturing in 2017 decreased by 0,8% for the 1st half-year, and increased by 1% for the whole year. Manufacturing for the 7 months of 2018 decreased by 0,5% and increased by 0,4 for 2017-2018 on average.
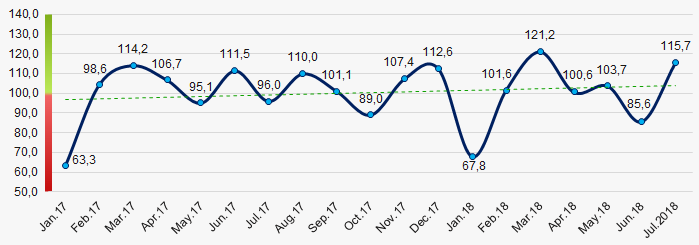 Picture 16. Index of industrial production in metallurgy, month to month (%)