Measures of support for systemically important enterprises
The company’s selection rules for inclusion in the industry systematic lists and measures of support during the economic crisis were defined by the Decree of the Government of the Russian Federation No 651 from 10.05.2020.
According to the Decree, the support is provided in the following ways:
- cost recovery subsidies, as well as the subsidies for reimbursement of part of the costs due to production and sale of goods, carrying-out of work or provision of services;
- deferrals of tax and advance tax payment;
- government guarantees on loans or bonded debts which are raised by companies to solve urgent tasks to ensure the sustainability of economic development;
The systemically important enterprises will be able to count on one or more support measures in case the conditions below are met jointly:
- the company is not a foreign legal entity or a Russian legal entity with direct or indirect share of foreign participation exceeding 50%. The decision not to apply this rule to the organization can be taken by the Government Commission on stability improvement of the Russian economy;
- analysis of company’s financial and economic activities and assessment of its financial stability, i.e. a stress-test;
- the company may have arrears on taxes, fees and other mandatory payments not exceeding 10,000 RUB in total, it should also not have overdue arrears on return of subsidies to the Federal budget or budget investments provided in accordance with other regulatory legal acts on the date of filing the application for support.
To get the support, it is necessary to send the application to the industry authority and the Ministry of Economic Development of the Russian Federation with the attached list of documents.
The Decree also defined the procedure for application processing and decision making procedure on providing support.
The Ministry of Economic Development of the Russian Federation is responsible for the maintaining of the Register of systemically important enterprises, which includes companies with support provided by the Government Commission on stability improvement of the Russian economy.
The Register should contain the data on systemically important enterprises, forms, volumes, terms and conditions for providing support, as well as details of the adopted decisions.
They are available in «Lists we recommend» of the Information and Analytical system Globas.
Trends in flour trading
Information agency Credinform has prepared a review of trends of the largest Russian companies engaged in trade with flour and macaroni products.
The largest trading companies (TOP-100) in terms of annual revenue were selected for the analysis according to the data from the Statistical Register for the latest available periods (2013-2018). The analysis was based on the data of the Information and Analytical system Globas.
Net assets are total assets less total liabilities. This indicator reflects the real value of the property of an enterprise. When the company’s debt exceeds the value of its property, the indicator is considered negative (insufficiency of property).
The largest company in term of net assets is LLC DOSHIRAK RUS, INN 7729663418, Moscow. In 2018, net assets value of the company exceeded 5 billion RUB.
The lowest net assets volume among TOP-100 belonged to LLC ITAL CITY FOOD, INN 7729756430, Moscow. In 2018, insufficiency of property of the company was indicated in negative value of -79 million RUB.
Covering the ten-year period, the average net assets values have a trend to increase (Picture 1).
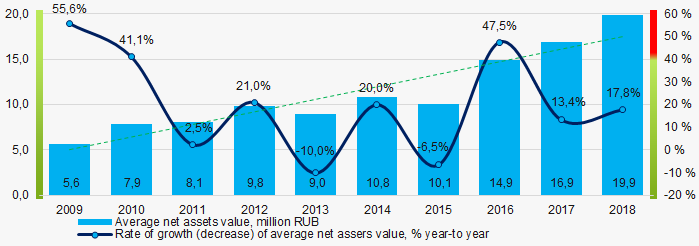 Picture 1. Change in average net assets value in 2009 – 2018
The shares of TOP-1000 companies with insufficient property have trend to increase over the past five years (Picture 2).
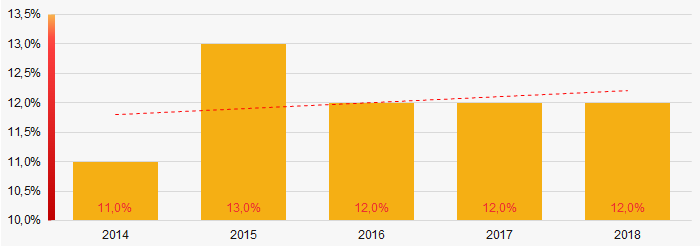 Picture 2. Shares of companies with negative net assets value in TOP-1000
Sales revenue
In 2018, the revenue volume of 10 largest companies of the industry was 74% of total TOP-1000 revenue (Picture 3). This is indicative of high level of monopolization in the industry.
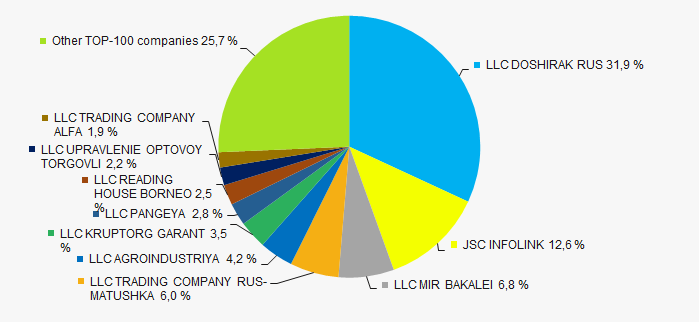 Picture 3. The share of TOP-10 companies in total 2018 revenue of TOP-1000
 In general, there is a trend to decrease in revenue (Picture 4).
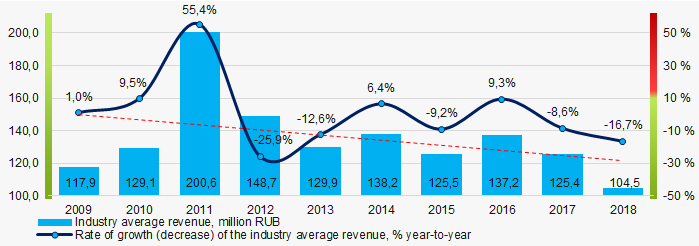 Picture 4. Change in industry average net profit in 2009-2018
Profit and loss
The largest company in term of net profit is LLC DOSHIRAK RUS, INN 7729663418, Moscow. The company’s profit for 2018 exceeded 10 billion RUB.
Covering the ten-year period, there is a trend to increase in average net profit (Picture 5).
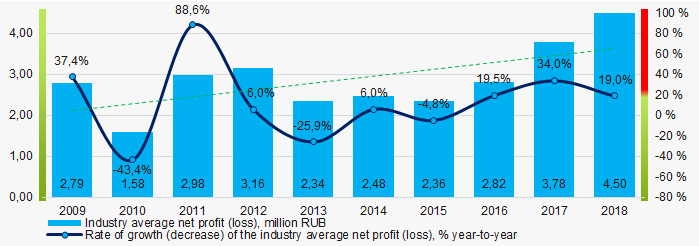 Picture 5. Change in industry average net profit (loss) values in 2009 – 2018
For the five-year period, the average net profit values of TOP-100 have the increasing trend with the increasing net loss (Picture 6).
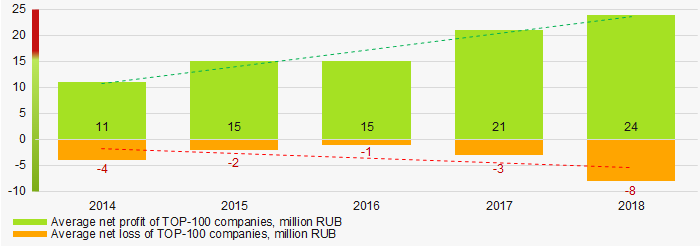 Picture 6. Change in average net profit and net loss of ТОP-100 in 2014 – 2018
Key financial ratios
Covering the ten-year period, the average values of the current liquidity ratio within the recommended one - from 1,0 to 2,0 with a trend to increase (Picture 7).
Current liquidity ratio (current assets to short-term liabilities) shows the sufficiency of company’s assets to repay on short-term liabilities.
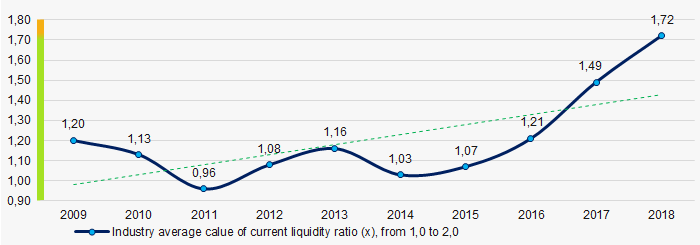 Picture 7. Change in industry average values of current liquidity ratio in 2009 – 2018
 Covering the ten-year period, the average values of ROI ratio have a trend to decrease (Picture 8).
ROI ratio is calculated as net profit to sum of shareholders equity and long-term liabilities, and shows the return of equity involved in commercial activities and long-term borrowed funds.
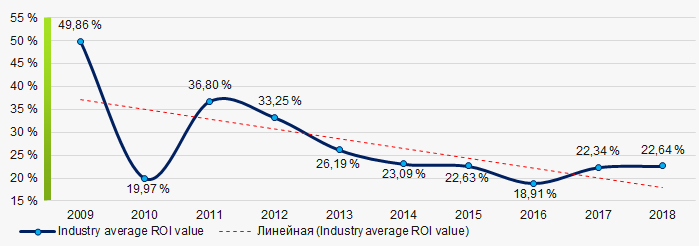 Picture 8. Change in average values of ROI ratio in 2009 – 2018
Assets turnover ratio is the ratio of sales revenue and company’s average total assets for a period. It characterizes the effectiveness of using of all available resources, regardless the source of their attraction. The ratio shows how many times per year the full cycle of production and circulation is performed, generating the corresponding effect in the form of profit.
Covering the ten-year period, business activity ratio demonstrated the increasing trend (Picture 9).
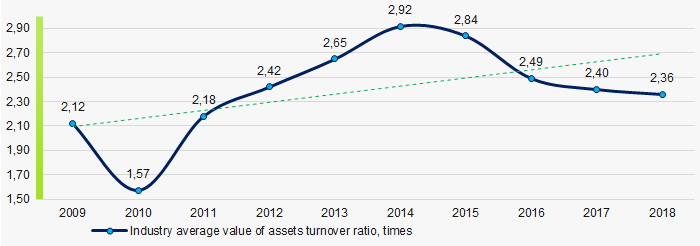 Picture 9. Change in average values of assets turnover ratio in 2009 – 2018
Small business
92% companies of TOP-100 are registered in the Register of small and medium-sized enterprises of the Federal Tax Service of the Russian Federation. At the same time, their share in total revenue of TOP-100 companies is almost 46% that is double on the national average figure (Picture 10).
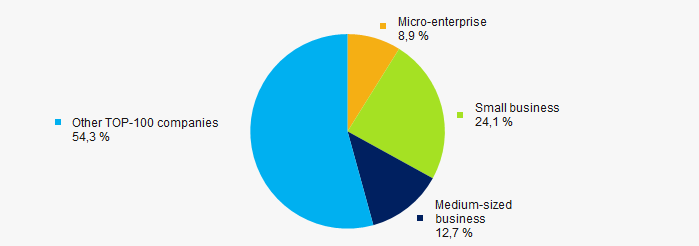 Picture 10. Shares of small and medium-sized enterprises in TOP-100
Main regions of activity
Companies of TOP-100 are registered in 37 regions of Russia, and unequally located across the country. Almost 57% of companies largest by revenue are located in Moscow (Picture 11).
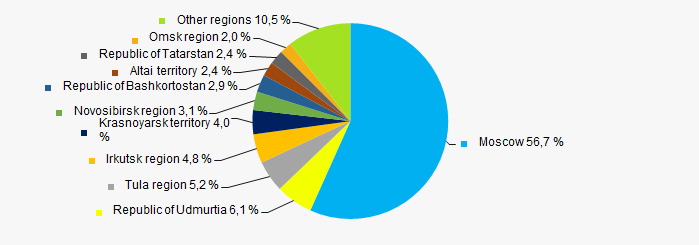 Picture 11. Distribution of TOP-100 revenue by regions of Russia
Financial position score
Assessment of the financial position of TOP-100 companies shows that the majority of them have stable financial position (Picture 12).
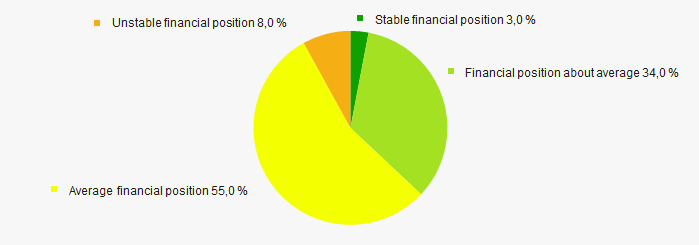 Picture 12. Distribution of TOP-100 companies by financial position score
Solvency index Globas
Most of TOP-100 companies got Superior / High and Strong / Medium index Globas. This fact shows their ability to meet their obligations fully (Picture 13).
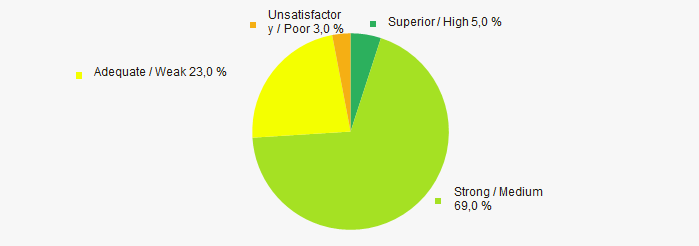 Picture 13. Distribution of TOP-100 companies by solvency index Globas
Conclusion
Complex assessment of activity of the largest Russian companies engaged in special construction, taking into account the main indexes, financial ratios and indicators, demonstrates the prevalence of positive trends (Table 1).
| Trends and evaluation factors | Relative share of factors, % |
| Rate of growth (decline) in the average size of net assets |  10 10 |
| Increase / decrease in the share of enterprises with negative values of net assets |  -10 -10 |
| Level of competition / monopolization |  -10 -10 |
| Rate of growth (decline) in the average size of revenue |  -10 -10 |
| Rate of growth (decline) in the average size of profit (loss) |  10 10 |
| Growth / decline in average values of companies’ net profit |  10 10 |
| Growth / decline in average values of companies’ net loss |  -10 -10 |
| Increase / decrease in average values of total liquidity ratio |  10 10 |
| Increase / decrease in average values of return on investment ratio |  -10 -10 |
| Increase / decrease in average values of asset turnover ratio, times |  10 10 |
| Share of small and medium-sized businesses in terms of revenue being more than 21% |  10 10 |
| Regional concentration |  -10 -10 |
| Financial position (the largest share) |  5 5 |
| Solvency index Globas (the largest share) |  10 10 |
| Average value of relative share of factors |  1,1 1,1 |
 positive trend (factor),
  negative trend (factor).