
Order a report
Custom-made industry research, company ratings, competitor analysis


Russia changes trade partners and diversifies export
Devaluation of the ruble, sanctions, poor conditions in the commodity markets and the general deterioration of the macroeconomic situation led to a significant reduction in the volume of foreign trade turnover: for January-August 2015 the import of goods and services to Russia in monetary terms fell by 38,9% (from 193,3 bln USD to 118,1 bln USD) in accordance with the correspondence period of 2014; the export reduced by 31,6% (from 343,1 bln USD to 234,5 bln USD). The positive trade surplus amounted to 116,4 bln USD, that indicates the stable demand on the Russian exported goods in the foreign market.
Speaking about Russia’s foreign partners, the attention to the countries of the Eurasian economic union and BRICS (Brazil, Russia, India, China and South Africa) should to be paid. The share of these countries in the total export/import volume is increasing and EU countries’ share is reducing.
Kazakhstan can be mentioned an example, appeared for the first time in the Top-10 of countries leading in export of Russian goods and rose by 3 positions at once. Ukraine, formerly included in the Top-10, fell by 6 positions during the period under review, and quit the list of the Russia’s main trade partners. Today the Ukraine’s share in the Russian export is 2,5% or 6 bln USD (12th position).
| Position | Country | Export volume, USD | Share in the total export, % |
|---|---|---|---|
| 1 |
The Netherlands |
28 828 554 354 | 12,29 |
| 2 |
China |
19 063 235 628 | 8,13 |
| 3 |
Germany |
17 554 315 893 | 7,48 |
| 4 |
Italy |
16 801 974 351 | 7,16 |
| 5 |
Turkey |
13 697 707 426 | 5,84 |
| 6 |
Belarus |
10 192 098 195 | 4,35 |
| 7 |
Japan |
9 834 184 809 | 4,19 |
| 8 |
The Republic of Korea |
8 934 083 100 | 3,81 |
| 9 |
Kazakhstan |
7 184 834 689 | 3,06 |
| 10 |
Poland |
6 718 996 534 | 2,86 |
| 11 |
The United States |
6 607 395 310 | 2,82 |
| 12 |
Ukraine |
5 974 043 272 | 2,55 |
| 13 |
Latvia |
5 410 686 277 | 2,31 |
| 14 |
The United Kingdom |
5 375 219 595 | 2,29 |
| 15 |
Finland |
4 756 204 352 | 2,03 |
| 16 |
Belgium |
4 371 318 534 | 1,86 |
| 17 |
France |
3 822 478 733 | 1,63 |
| 18 |
India |
3 637 097 581 | 1,55 |
| 19 |
Slovakia |
2 566 763 544 | 1,09 |
| 20 |
The Czech Republic |
2 264 094 344 | 0,97 |
| 21 |
Egypt |
2 029 321 083 | 0,87 |
| 22 |
Hungary |
2 004 747 554 | 0,85 |
| 23 |
Сингапур |
1 933 057 902 | 0,82 |
| 24 |
Lithuania |
1 925 557 069 | 0,82 |
| 25 |
Taiwan (China) |
1 820 667 143 | 0,78 |
| 26 |
Swiss |
1 737 626 680 | 0,74 |
| 27 |
Malta |
1 728 424 935 | 0,74 |
| 28 |
Spain |
1 715 810 897 | 0,73 |
| 29 |
Greece |
1 700 641 604 | 0,73 |
| 30 |
Switzerland |
1 658 223 490 | 0,71 |
| 31 |
Azerbaijan |
1 567 546 955 | 0,67 |
| 32 |
Estonia |
1 565 278 832 | 0,67 |
| 33 |
Uzbekistan |
1 507 050 201 | 0,64 |
| 34 |
Denmark |
1 424 293 532 | 0,61 |
| 35 |
Brazil |
1 376 513 561 | 0,59 |
| 36 |
Iraq |
1 371 154 186 | 0,58 |
| 37 |
Romania |
1 085 771 371 | 0,46 |
| 38 |
Bulgaria |
1 076 758 342 | 0,46 |
| 39 |
Israel |
1 071 669 970 | 0,46 |
| 40 |
Vietnam |
936 659 751 | 0,40 |
| 41 |
Kirgizia |
883 439 375 | 0,38 |
| 42 |
Algeria |
732 637 799 | 0,31 |
| 43 |
Croatia |
728 038 805 | 0,31 |
| 44 |
Austria |
719 950 042 | 0,31 |
| 45 |
The Republic of Moldova |
716 201 059 | 0,31 |
| 46 |
Mongolia |
713 131 122 | 0,30 |
| 47 |
Mexico |
689 649 481 | 0,29 |
| 48 |
The United Arabian Emirates |
651 360 326 | 0,28 |
| 49 |
Iran, the Islamic Republic |
627 411 090 | 0,27 |
| 50 |
Armenia |
622 185 175 | 0,27 |
| 51 |
Hong Kong |
601 967 964 | 0,26 |
| 52 |
Turkmenistan |
543 338 241 | 0,23 |
| 53 |
Serbia |
518 826 503 | 0,22 |
| 54 |
Saudi Arabia |
518 664 998 | 0,22 |
| 55 |
Gibraltar |
502 768 828 | 0,21 |
| 56 |
Malaysia |
493 505 148 | 0,21 |
| 57 |
Tajikistan |
490 925 011 | 0,21 |
| 58 |
Norway |
472 186 025 | 0,20 |
| 59 |
Lebanon |
422 649 238 | 0,18 |
| 60 |
Thailand |
407 883 726 | 0,17 |
| 61 |
Канада |
357 416 201 | 0,15 |
| 62 |
Venezuela |
324 513 943 | 0,14 |
| 63 |
New Zeeland |
319 266 290 | 0,14 |
| 64 |
Morocco |
318 460 712 | 0,14 |
| 65 |
Georgia |
308 530 442 | 0,13 |
| 66 |
Peru |
288 673 547 | 0,12 |
| 67 |
Indonesia |
284 636 570 | 0,12 |
| 68 |
Philippines |
259 425 932 | 0,11 |
| 69 |
The Syrian Arab Republic |
224 372 423 | 0,10 |
| 70 |
Bangladesh |
222 073 908 | 0,09 |
| 71 |
Bosnia and Herzegovina |
205 265 318 | 0,09 |
| 72 |
Tunisia |
182 138 957 | 0,08 |
| 73 |
Cyprus |
164 939 761 | 0,07 |
| 74 |
Nigeria |
163 587 734 | 0,07 |
| 75 |
South Africa |
162 656 848 | 0,07 |
| 76 |
Portugal |
162 338 956 | 0,07 |
| 77 |
Kuwait |
156 640 350 | 0,07 |
| 78 |
Ireland |
150 874 945 | 0,06 |
| 79 |
Angola |
142 990 688 | 0,06 |
| 80 |
Columbia |
142 272 608 | 0,06 |
| 81 |
Ecuador |
135 815 211 | 0,06 |
| 82 |
Yemen |
133 549 671 | 0,06 |
| 83 |
Trinidad and Tobago |
125 579 483 | 0,05 |
| 84 |
Abkhazia |
125 334 908 | 0,05 |
| 85 |
Afghanistan |
116 499 259 | 0,05 |
| 86 |
Jordan |
116 472 393 | 0,05 |
| 87 |
Kenia |
111 430 439 | 0,05 |
| 88 |
Jersey |
101 851 698 | 0,04 |
| 89 |
Toho |
92 622 610 | 0,04 |
| 90 |
Libya |
87 084 824 | 0,04 |
| 91 |
Ruanda |
85 878 517 | 0,04 |
| 92 |
Sudan |
85 721 235 | 0,04 |
| 93 |
Sri-Lanka |
84 470 272 | 0,04 |
| 94 |
Myanmar |
82 517 350 | 0,04 |
| 95 |
Slovenia |
77 759 622 | 0,03 |
| 96 |
Hana |
77 565 834 | 0,03 |
| 97 |
Bahamas |
72 681 866 | 0,03 |
| 98 |
The Dominican Republic |
71 973 528 | 0,03 |
| 99 |
Australia |
69 077 714 | 0,03 |
| 100 |
Argentina |
67 795 958 | 0,03 |
| 101 |
Pakistan |
64 683 771 | 0,03 |
| 102 |
Cuba |
60 266 933 | 0,03 |
| 103 |
The United Republic of Tanzania |
56 964 654 | 0,02 |
| 104 |
The British Virgin islands |
55 825 993 | 0,02 |
| 105 |
The Democratic People's Republic of Korea |
53 850 109 | 0,02 |
| 106 |
Oman |
51 984 731 | 0,02 |
| 107 |
French Guiana |
49 625 025 | 0,02 |
| 108 |
Chile |
45 995 680 | 0,02 |
| 109 |
The Republic of Macedonia |
44 175 741 | 0,02 |
| 110 |
Panama |
38 789 873 | 0,02 |
| 111 |
Albania |
38 494 998 | 0,02 |
| 112 |
Senegal |
37 076 030 | 0,02 |
| 113 |
Luxemburg |
33 955 042 | 0,01 |
| 114 |
Guatemala |
33 188 024 | 0,01 |
| 115 |
Nepal |
32 734 608 | 0,01 |
| 116 |
Mozambique |
31 939 687 | 0,01 |
| 117 |
South Ossetia |
29 382 536 | 0,01 |
| 118 |
Puerto Rico |
26 671 219 | 0,01 |
| 119 |
Montenegro |
25 232 011 | 0,01 |
| 120 |
Côte d'Ivoire |
24 608 229 | 0,01 |
| 121 |
The Democratic Republic of the Congo |
22 406 679 | 0,01 |
| 122 |
Honduras |
19 737 192 | 0,01 |
| 123 |
Belize |
18 549 753 | 0,01 |
| 124 |
Botswana |
18 228 572 | 0,01 |
| 125 |
Nicaragua |
17 985 267 | 0,01 |
| 126 |
Costa-Rica |
17 734 061 | 0,01 |
| 127 |
Uruguay |
15 966 600 | 0,01 |
| 128 |
Djibouti |
14 779 461 | 0,01 |
| 129 |
Mauritania |
12 804 205 | 0,01 |
| 130 |
Paraguay |
11 287 177 | 0,00 |
| 131 |
Uganda |
11 157 233 | 0,00 |
| 132 |
El-Salvador |
10 683 187 | 0,00 |
| 133 |
Malawi |
10 250 545 | 0,00 |
| 134 |
Qatar |
9 860 479 | 0,00 |
| 135 |
The Federated States of Micronesia |
9 797 499 | 0,00 |
| 136 |
Laos |
8 625 693 | 0,00 |
| 137 |
Ethiopia |
8 446 157 | 0,00 |
| 138 |
Iceland |
8 006 919 | 0,00 |
| 139 |
Congo |
7 985 955 | 0,00 |
| 140 |
Guinea |
7 308 176 | 0,00 |
| 141 |
Kameron |
5 899 009 | 0,00 |
| 142 |
Falkland Islands (Malvinas) |
5 093 448 | 0,00 |
| 143 |
Faeroes |
4 920 066 | 0,00 |
| 144 |
Haiti |
4 790 515 | 0,00 |
| 145 |
Zambia |
4 502 623 | 0,00 |
| 146 |
Mali |
3 908 591 | 0,00 |
| 147 |
Bahrein |
3 421 953 | 0,00 |
| 148 |
Namibia |
3 246 971 | 0,00 |
| 149 |
Nauru |
3 046 997 | 0,00 |
| 150 |
Liberia |
2 733 558 | 0,00 |
| 151 |
Papua-New Guinea |
2 565 857 | 0,00 |
| 152 |
Bolivia |
2 540 065 | 0,00 |
| 153 |
Gambia |
2 211 691 | 0,00 |
| 154 |
Zimbabwe |
2 099 672 | 0,00 |
| 155 |
Andorra |
1 852 000 | 0,00 |
| 156 |
Seychelles |
1 706 570 | 0,00 |
| 157 |
Sierra-Leone |
1 604 732 | 0,00 |
| 158 |
Palestinian territories |
1 531 840 | 0,00 |
| 159 |
Cambodia |
1 339 100 | 0,00 |
| 160 |
Sent-Kits and Nevis |
1 267 235 | 0,00 |
| 161 |
New Caledonia |
1 254 265 | 0,00 |
| 162 |
EU countries |
1 239 137 | 0,00 |
| 163 |
Equatorial Guinea |
1 202 046 | 0,00 |
| 164 |
Burkina-Faso |
1 075 784 | 0,00 |
| 165 |
Macao |
1 016 434 | 0,00 |
| 166 |
Somali |
1 014 703 | 0,00 |
| 167 |
Mauritius |
1 012 548 | 0,00 |
| 168 |
Chad |
915 569 | 0,00 |
| 169 |
Curacao |
840 313 | 0,00 |
| 170 |
Burundi |
769 191 | 0,00 |
| 171 |
South Sudan |
745 287 | 0,00 |
| 172 |
Norfolk island |
742 000 | 0,00 |
| 173 |
Niger |
567 051 | 0,00 |
| 174 |
Sao Tome and Principe |
543 343 | 0,00 |
| 175 |
Cayman islands |
494 488 | 0,00 |
| 176 |
Monaco |
439 448 | 0,00 |
| 177 |
Gabon |
405 102 | 0,00 |
| 178 |
Benin |
331 518 | 0,00 |
| 179 |
Jamaica |
299 259 | 0,00 |
| 180 |
Brunei Darussalam |
236 524 | 0,00 |
| 181 |
Isle of Man |
157 674 | 0,00 |
| 182 |
Madagascar |
146 257 | 0,00 |
| 183 |
Bhutan |
124 600 | 0,00 |
| 184 |
Guyana |
123 782 | 0,00 |
| 185 |
Surinam |
118 303 | 0,00 |
| 186 |
Lichtenstein |
84 596 | 0,00 |
| 187 |
Reunion |
68 960 | 0,00 |
| 188 |
Cabo-Verde |
46 698 | 0,00 |
| 189 |
Palau |
44 281 | 0,00 |
| 190 |
French Polynesia |
27 056 | 0,00 |
| 191 |
Fiji |
24 800 | 0,00 |
| 192 |
Svalbard and Jan Mayen |
22 750 | 0,00 |
| 193 |
Mayotte |
20 498 | 0,00 |
| 194 |
Martinique |
20 000 | 0,00 |
| 195 |
Guadalupe |
14 024 | 0,00 |
| 196 |
San-Marino |
8 367 | 0,00 |
| 197 |
Sent-Vincent and Grenadines |
6 514 | 0,00 |
| 198 |
Maldives |
4 365 | 0,00 |
| 199 |
Dominica |
400 | 0,00 |
| 200 |
Guernsey |
20 | 0,00 |
For the period of January-August 2015, China has increased the share in the total import by 1,7%. Belarus and Kazakhstan also increased their shares. Ukraine reduced the supplies share by 1% and today 3,2% of imported goods and services on the total amount of 3,7 bln USD fell to this country.
| Position | Country | Export volume, USD | Share in the total export, % |
|---|---|---|---|
| 1 | China | 22 355 681 693 | 18,93 |
| 2 | Germany | 13 018 351 631 | 11,02 |
| 3 | The United States | 7 871 293 870 | 6,66 |
| 4 | Belarus | 5 710 633 458 | 4,83 |
| 5 | Italy | 5 147 815 780 | 4,36 |
| 6 | Japan | 4 431 028 551 | 3,75 |
| 7 | Ukraine | 3 726 346 930 | 3,15 |
| 8 | France | 3 675 254 356 | 3,11 |
| 9 | Kazakhstan | 3 571 023 684 | 3,02 |
| 10 | The Republic of Korea | 3 007 452 638 | 2,55 |
| 11 | Turkey | 2 733 783 502 | 2,31 |
| 12 | Poland | 2 637 116 569 | 2,23 |
| 13 | The United Kingdom | 2 490 771 438 | 2,11 |
| 14 | Brazil | 1 880 149 491 | 1,59 |
| 15 | The Netherlands | 1 849 082 881 | 1,57 |
| 16 | Czech Republic | 1 835 038 651 | 1,55 |
| 17 | Finland | 1 740 484 952 | 1,47 |
| 18 | Spain | 1 720 455 952 | 1,46 |
| 19 | India | 1 493 368 984 | 1,26 |
| 20 | Belgium | 1 364 254 074 | 1,16 |
| 21 | Austria | 1 273 643 843 | 1,08 |
| 22 | Vietnam | 1 266 823 155 | 1,07 |
| 23 | Swiss | 1 256 574 596 | 1,06 |
| 24 | Slovakia | 1 135 549 954 | 0,96 |
| 25 | Switzerland | 1 119 124 960 | 0,95 |
| 26 | Hungary | 1 106 309 169 | 0,94 |
| 27 | Indonesia | 990 838 875 | 0,84 |
| 28 | Thailand | 930 916 013 | 0,79 |
| 29 | Romania | 873 889 723 | 0,74 |
| 30 | Taiwan (China) | 798 137 270 | 0,68 |
| 31 | Ecuador | 760 333 492 | 0,64 |
| 32 | Malaysia | 758 436 143 | 0,64 |
| 33 | Israel | 592 988 832 | 0,50 |
| 34 | Paraguay | 588 340 124 | 0,50 |
| 35 | Denmark | 580 114 988 | 0,49 |
| 36 | Argentina | 563 776 827 | 0,48 |
| 37 | Slovenia | 551 911 321 | 0,47 |
| 38 | Ireland | 509 758 340 | 0,43 |
| 39 | Serbia | 491 128 295 | 0,42 |
| 40 | Canada | 457 338 150 | 0,39 |
| 41 | Chile | 440 954 378 | 0,37 |
| 42 | Mexico | 416 769 474 | 0,35 |
| 43 | Bangladesh | 412 150 643 | 0,35 |
| 44 | South Africa | 405 241 788 | 0,34 |
| 45 | Australia | 396 785 349 | 0,34 |
| 46 | Uzbekistan | 392 906 344 | 0,33 |
| 47 | Egypt | 361 281 361 | 0,31 |
| 48 | Estonia | 358 539 208 | 0,30 |
| 49 | Singapore | 345 454 956 | 0,29 |
| 50 | Norway | 343 820 038 | 0,29 |
| 51 | Azerbaijan | 316 507 718 | 0,27 |
| 52 | Lithuania | 293 389 699 | 0,25 |
| 53 | Bulgaria | 293 337 169 | 0,25 |
| 54 | Morocco | 278 450 944 | 0,24 |
| 55 | Latvia | 270 080 291 | 0,23 |
| 56 | Portugal | 257 546 782 | 0,22 |
| 57 | Pakistan | 240 831 075 | 0,20 |
| 58 | Sri-Lanka | 202 223 846 | 0,17 |
| 59 | Iran, the Islamic Republic | 175 993 489 | 0,15 |
| 60 | Faeroes | 148 107 938 | 0,13 |
| 61 | Greece | 142 330 036 | 0,12 |
| 62 | Hong Kong | 140 427 911 | 0,12 |
| 63 | Philippines | 139 778 040 | 0,12 |
| 64 | Croatia | 131 316 453 | 0,11 |
| 65 | The Republic of Moldova | 119 042 786 | 0,10 |
| 66 | United Arabian Emirates | 116 357 917 | 0,10 |
| 67 | Kenya | 114 195 159 | 0,10 |
| 68 | Iceland | 99 404 011 | 0,08 |
| 69 | Saudi Arabia | 97 778 933 | 0,08 |
| 70 | Armenia | 96 658 105 | 0,08 |
| 71 | Georgia | 93 104 314 | 0,08 |
| 72 | Côte d'Ivoire | 92 055 418 | 0,08 |
| 73 | Puerto-Rico | 83 911 978 | 0,07 |
| 74 | Jamaica | 78 634 244 | 0,07 |
| 75 | Columbia | 78 012 330 | 0,07 |
| 76 | Luxemburg | 73 107 071 | 0,06 |
| 77 | Uruguay | 71 078 191 | 0,06 |
| 78 | Cambodia | 70 083 240 | 0,06 |
| 79 | New Zeeland | 68 095 458 | 0,06 |
| 80 | Tunisia | 66 814 347 | 0,06 |
| 81 | The Republic of Macedonia | 56 977 414 | 0,05 |
| 82 | Peru | 55 256 334 | 0,05 |
| 83 | Costa-Rica | 51 708 859 | 0,04 |
| 84 | Turkmenistan | 47 381 052 | 0,04 |
| 85 | Kirgizia | 46 652 129 | 0,04 |
| 86 | Ghana | 43 985 945 | 0,04 |
| 87 | Cuba | 41 324 584 | 0,03 |
| 88 | Tajikistan | 36 786 533 | 0,03 |
| 89 | Bosnia and Herzegovina | 36 631 417 | 0,03 |
| 90 | UE countries | 35 816 550 | 0,03 |
| 91 | Malawi | 33 824 033 | 0,03 |
| 92 | Mongolia | 32 646 159 | 0,03 |
| 93 | Mozambique | 30 944 935 | 0,03 |
| 94 | The United Republic of Tanzania | 29 212 165 | 0,02 |
| 95 | Abkhazia | 28 922 016 | 0,02 |
| 96 | Cyprus | 25 370 627 | 0,02 |
| 97 | Greenland | 24 497 551 | 0,02 |
| 98 | Zimbabwe | 23 168 756 | 0,02 |
| 99 | Malta | 16 994 166 | 0,01 |
| 100 | Nigeria | 16 198 709 | 0,01 |
| 101 | Ethiopia | 14 451 531 | 0,01 |
| 102 | Jordan | 13 012 942 | 0,01 |
| 103 | Uganda | 11 482 455 | 0,01 |
| 104 | Myanmar | 10 729 692 | 0,01 |
| 105 | Albania | 9 137 008 | 0,01 |
| 106 | Mauritania | 8 855 175 | 0,01 |
| 107 | Honduras | 8 568 541 | 0,01 |
| 108 | Guatemala | 8 195 445 | 0,01 |
| 109 | Qatar | 7 874 394 | 0,01 |
| 110 | The British Virgin islands | 7 542 651 | 0,01 |
| 111 | Zambia | 7 126 588 | 0,01 |
| 112 | The Dominican Republic | 7 093 408 | 0,01 |
| 113 | Lebanon | 6 168 484 | 0,01 |
| 114 | Afghanistan | 5 816 643 | 0,00 |
| 115 | Bahrein | 5 266 883 | 0,00 |
| 116 | Nicaragua | 5 266 006 | 0,00 |
| 117 | Bolivia | 5 109 735 | 0,00 |
| 118 | Madagascar | 4 865 597 | 0,00 |
| 119 | Lichtenstein | 4 688 793 | 0,00 |
| 120 | South Ossetia | 4 481 798 | 0,00 |
| 121 | Algeria | 4 386 116 | 0,00 |
| 122 | Mauritius | 4 377 829 | 0,00 |
| 123 | Papua-New Guinea | 4 230 142 | 0,00 |
| 124 | The Syrian Arab Republic | 4 044 102 | 0,00 |
| 125 | Senegal | 3 565 658 | 0,00 |
| 126 | Cameroon | 3 451 149 | 0,00 |
| 127 | The Democratic People's Republic of Korea | 2 397 547 | 0,00 |
| 128 | San-Marino | 2 315 742 | 0,00 |
| 129 | Oman | 2 077 606 | 0,00 |
| 130 | Venezuela | 1 991 504 | 0,00 |
| 131 | Ruanda | 1 890 839 | 0,00 |
| 132 | Montenegro | 1 868 697 | 0,00 |
| 133 | Guyana | 1 570 901 | 0,00 |
| 134 | Namibia | 1 565 265 | 0,00 |
| 135 | Macao | 1 364 556 | 0,00 |
| 136 | Seychelles | 1 323 576 | 0,00 |
| 137 | Falkland Islands (Malvinas) | 1 308 815 | 0,00 |
| 138 | Burundi | 1 184 256 | 0,00 |
| 139 | El-Salvador | 1 050 126 | 0,00 |
| 140 | Monaco | 1 018 280 | 0,00 |
| 141 | Sudan | 917 188 | 0,00 |
| 142 | Panama | 826 766 | 0,00 |
| 143 | Laos | 572 186 | 0,00 |
| 144 | Congo | 497 051 | 0,00 |
| 145 | Swaziland | 477 133 | 0,00 |
| 146 | Nepal | 433 675 | 0,00 |
| 147 | Trinidad and Tobago | 411 688 | 0,00 |
| 148 | French Guiana | 403 006 | 0,00 |
| 149 | Bahamas | 370 974 | 0,00 |
| 150 | Palestinian territories | 341 222 | 0,00 |
| 151 | Liberia | 328 515 | 0,00 |
| 152 | Cayman islands | 171 575 | 0,00 |
| 153 | Curacao | 157 017 | 0,00 |
| 154 | Sierra-Leone | 135 835 | 0,00 |
| 155 | Yemen | 127 819 | 0,00 |
| 156 | Isle of Men | 123 748 | 0,00 |
| 157 | Bhutan | 112 910 | 0,00 |
| 158 | Iraq | 107 547 | 0,00 |
| 159 | The Marshall Islands | 92 815 | 0,00 |
| 160 | Andorra | 81 492 | 0,00 |
| 161 | Haiti | 74 384 | 0,00 |
| 162 | Bermuda | 73 998 | 0,00 |
| 163 | Anguilla | 71 314 | 0,00 |
| 164 | Kuwait | 65 922 | 0,00 |
| 165 | Barbados | 65 454 | 0,00 |
| 166 | Virgin Islands, USA | 54 867 | 0,00 |
| 167 | Surinam | 51 892 | 0,00 |
| 168 | Fiji | 49 279 | 0,00 |
| 169 | Niger | 48 092 | 0,00 |
| 170 | Burkina-Faso | 39 385 | 0,00 |
| 171 | Livia | 35 106 | 0,00 |
| 172 | Pitcairn | 33 306 | 0,00 |
| 173 | Somali | 30 481 | 0,00 |
| 174 | Mali | 26 658 | 0,00 |
| 175 | Reunion | 26 232 | 0,00 |
| 176 | Guinea | 25 359 | 0,00 |
| 177 | Gabon | 24 912 | 0,00 |
| 178 | Benin | 24 464 | 0,00 |
| 179 | Komori | 24 060 | 0,00 |
| 180 | Vanuatu | 20 910 | 0,00 |
| 181 | Solomon Islands | 20 880 | 0,00 |
| 182 | Equatorial Guinea | 19 154 | 0,00 |
| 183 | Central African Republic | 18 096 | 0,00 |
| 184 | Maldives | 16 215 | 0,00 |
| 185 | Gibraltar | 11 142 | 0,00 |
| 186 | Jersey | 8 629 | 0,00 |
| 187 | Eritrea | 7 667 | 0,00 |
| 188 | Angola | 7 192 | 0,00 |
| 189 | Aland Islands | 5 210 | 0,00 |
| 190 | The Democratic Republic of the Congo | 4 947 | 0,00 |
| 191 | Sao Tome and Principe | 4 613 | 0,00 |
| 192 | Grenada | 3 529 | 0,00 |
| 193 | Turks and Caicos Islands | 3 388 | 0,00 |
| 194 | The United States Minor Outlying Islands | 3 241 | 0,00 |
| 195 | South Sudan | 3 129 | 0,00 |
| 196 | Cabo-Verde | 2 954 | 0,00 |
| 197 | Belize | 2 401 | 0,00 |
| 198 | Lesotho | 2 241 | 0,00 |
| 199 | Niue | 1 918 | 0,00 |
| 200 | Vatican City State | 1 776 | 0,00 |
| 201 | Tokelau | 1 677 | 0,00 |
| 202 | Wallis and Futuna Islands | 1 411 | 0,00 |
| 203 | Christmas Island | 1 262 | 0,00 |
| 204 | Nauru | 1 030 | 0,00 |
| 205 | French Polynesia | 851 | 0,00 |
| 206 | Dominica | 630 | 0,00 |
| 207 | The British Indian Ocean Territory | 574 | 0,00 |
| 208 | Saint Helena | 416 | 0,00 |
| 209 | Gambia | 376 | 0,00 |
| 210 | The French Southern Territories | 345 | 0,00 |
| 211 | Svalbard and Jan Mayen | 256 | 0,00 |
| 212 | The Federated States of Micronesia | 236 | 0,00 |
| 213 | Montserrat | 132 | 0,00 |
| 214 | New Caledonia | 41 | 0,00 |
| 215 | South Georgia and the South Sandwich Islands | 36 | 0,00 |
| 216 | Aruba | 32 | 0,00 |
| 217 | American Samoa | 31 | 0,00 |
| 218 | Timor-Leste | 31 | 0,00 |
| 219 | Tuvalu | 31 | 0,00 |
| 220 | Guadalupe | 15 | 0,00 |
| 221 | Guinea-Bissau | 3 | 0,00 |
Speaking about the commodity structure of the foreign trade, the new trend can be noted: the share of the mineral fuel in the total export volume has significantly reduces (from 71,4% to 64,8%) in the period of January-August 2015. Despite this position continues playing the essential role, Russia begins to diversify its export. It is a kind of compulsory measure caused by falling HC-hydrocarbon prices. The total export volume of the mineral raw materials in the monetary terms amounted to 152,1 bln USD.
Other goods of the total export volume: ferrous metal (4,6% of the total export), fertilizers (2,6%), precious and semi-precious stones (2,4%), equipment and mechanical devices (2,4%), aluminum and goods thereof (2,2%), armament (2,1%), wood (1,8%), products of chemical industry (1,8%), copper and goods thereof (1,3%), cereals (1,3%), other foods and services (12,8%).
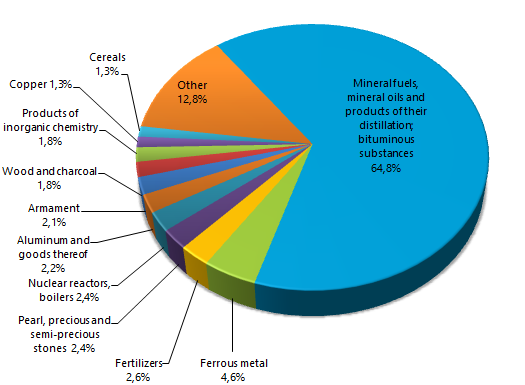
Picture 1. Commodity structure of export, January-August 2015г., % of total export in monetary terms
As for the import, the decrease in car industry by 3,2% can be explained the fall of cars demand among the population. The commodity structure in general remains the same and the reprocessing products are mainly purchased: mechanical equipment (18,6% of total import), electrical machinery and equipment (10,7%), cars (8,6%), pharmaceuticals (4,7%), plastics and products thereof (4,2%), optical equipment (2,6%), products of ferrous metals (2,6%) and others (see Picture 2).
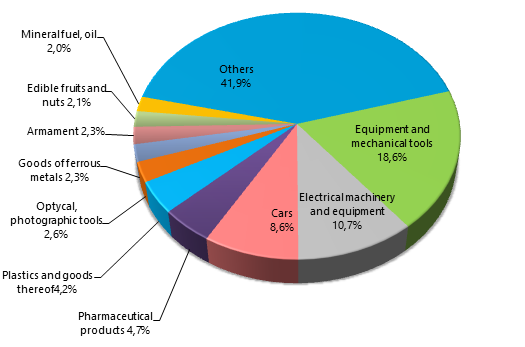
Picture 2. Commodity structure of import, January-August 2015г., % of total import in monetary terms
Summing up the results, the Credinform experts forecast the decrease in the foreign trade turnover will continue the current year following the external reasons, such as the ruble devaluation and falling the HC-hydrocarbon prices. The low base and a kind of stabilization in the currency market can lead to the restoration of positions in 2016.
The further diversifying of the commodity structure of our export will be likely continued. The domestic manufacturer was given a competitive advantage and its products became significantly cheaper for the foreign buyers that can be a key to the external markets.