
Order a report
Custom-made industry research, company ratings, competitor analysis


Trends in activity of hotels
Information agency Credinform has observed trends in the activity of the largest companies of the real sector of economy in Voronezh region
Enterprises with the largest volume of annual revenue (TOP-1000), were selected for the analysis, according to the data from the Statistical Register for the latest available periods (for 2013-2017). The analysis was made on the basis of the data of the Information and Analytical system Globas.
Net assets is an indicator, reflecting the real value of company's property, is calculated annually as the difference between assets on the enterprise balance and its debt obligations. The indicator of net assets is considered negative (insufficiency of property), if company’s debt exceeds the value of its property.
| № in TOP-1000 Name, INN, main type of activity |
Net assets value, billion RUB | Solvency index Globas | ||||
| 2013 | 2014 | 2015 | 2016 | 2017 | ||
| 1 | 2 | 3 | 4 | 5 | 6 | 7 |
| 1 JSC MINUDOBRENIYA INN 3627000397 Manufacture of fertilizers and nitrogen compounds |
|
|
|
|
|
209 Strong |
| 2 JSC ILYUSHIN FINANCE Co. INN 3663029916 Financial leasing (leasing/subleasing) |
|
|
|
|
|
289 Medium |
| 3 JSC Liski-Fitting INN 3652000930 Manufacture of tubes, pipes, hollow profiles and related fittings, of steel |
|
|
|
|
|
207 Strong |
| 4 JSC Voronezh Synthetic Rubber INN 3663002167 Manufacture of synthetic rubber in primary forms |
|
|
|
|
|
179 High |
| 5 JSC VORONEZH AIRCRAFT INN 3650000959 Manufacture of helicopters, aeroplanes and other aircraft |
|
|
|
|
|
273 Medium |
| 996 WOODVILLE LIMITED INN 3602006598 Manufacture of wooden building constructions and millwork Bankruptcy proceedings |
|
|
|
|
|
550 Insufficient |
| 997 JSC VIDEOPHONE INN 3661000333 Renting and operating of own or leased untenanted real estate Process of being wound up, 07.08.2017 |
|
|
|
|
|
600 Insufficient |
| 998 JSC CHERNOZEM COMMUTER PASSENGER COMPANY INN 3664108409 Passenger rail transport, interurban |
|
|
|
|
|
275 Medium |
| 999 JSC UZ-DAEWOO AUTO-VORONEZH INN 6451119803 Wholesale of motor cars and light motor vehicles Process of being wound up, 25.05.2017 |
|
|
|
|
|
273 Medium |
| 1000 KELLOGG RUS LLC INN 3661048688 Manufacture of preserved rusks, crackers and other rusk bakery products, pastry, cakes, fancy cakes, pies and biscuits |
|
|
|
|
|
260 Medium |
![]() — growth of the indicator to the previous period,
— growth of the indicator to the previous period, ![]() — decline of the indicator to the previous period.
— decline of the indicator to the previous period.
For a five-year period average amount of net assets of TOP-1000 companies has increasing tendency (Picture 1).
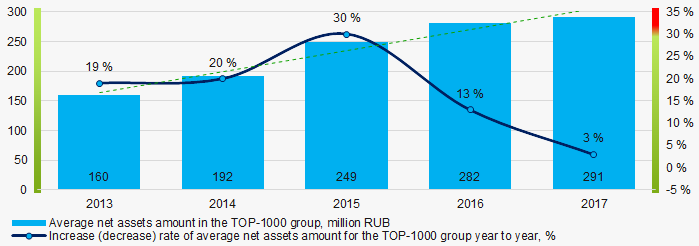 Picture 1. Change in TOP-1000 average indicators of the net asset amount in 2013 – 2017
Share of companies with insufficiency of property in the TOP-1000 has increasing trend for the last five years (Picture 2).
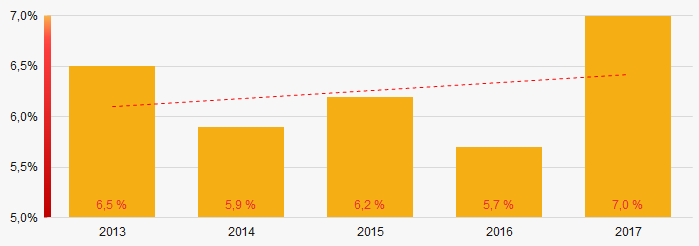 Picture 2. Shares of companies with negative values of net assets in TOP-1000 companies
Sales revenue
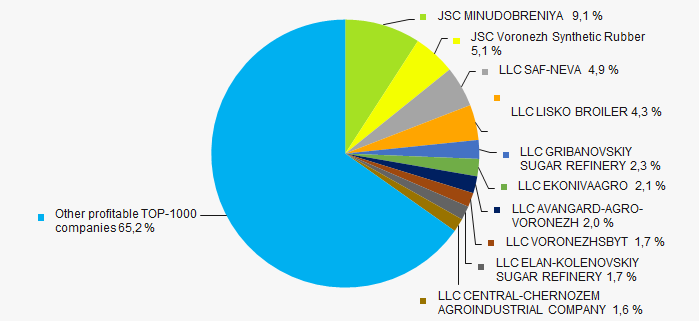
The revenue volume of 10 leaders of the industry made 21% of the total revenue of TOP-1000 companies in 2017(Picture 3). It demonstrates low level of productive concentration in Voronezh region.
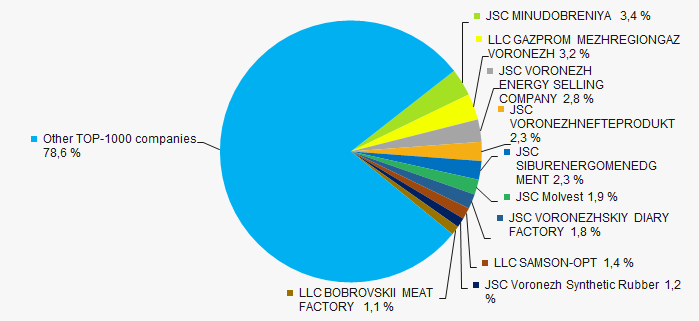 Picture 3. Shares of participation of TOP-10 companies in the total revenue of TOP-1000 companies for 2017
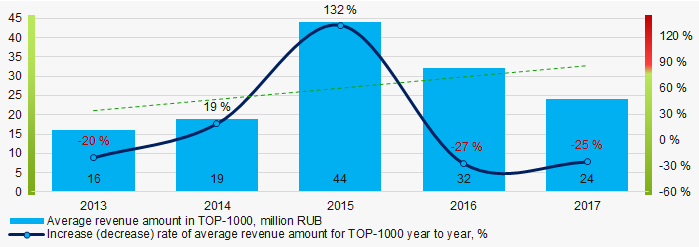
In general, an increasing tendency in revenue volume is observed (Picture 4).
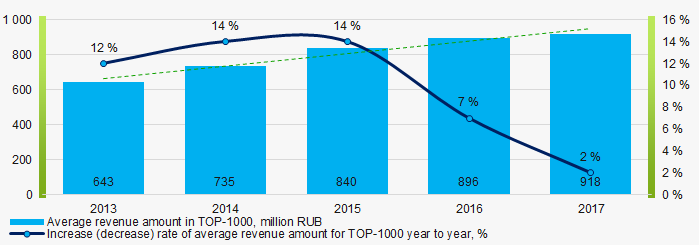 Picture 4. Change in the average revenue of TOP-1000 companies in 2013 – 2017
Profit and losses
The profit volume of 10 leading enterprises in 2017 made 35% of the total profit of TOP-1000 companies (Picture 5).
 Picture 5. Share of participation of TOP-10 companies in the total volume of profit of TOP-1000 companies for 2017
In general, the average values of profit indicators of TOP-1000 companies tend to increase over a five-year period (Picture 6).
 Picture 6. Change in the average indicators of profit and loss of TOP-1000 companies in 2013 – 2017
Over a five-year period, the average values of net profit indicators of TOP-1000 companies tend to increase. Besides, the average value of net loss decreases (Picture 7).
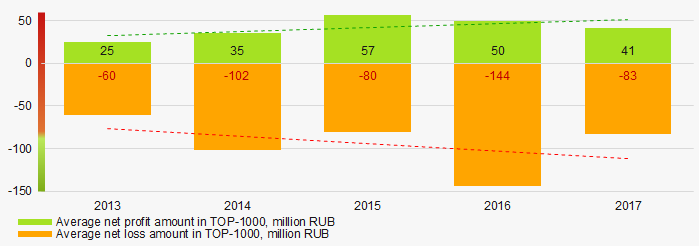 Picture 7. Change in the average indicators of net profit and loss of TOP-1000 companies in 2013 – 2017
Key financial ratios
Over the five-year period the average indicators of the current liquidity ratio of TOP-1000 were above the range of recommended values – from 1,0 up to 2,0 with increasing tendency (Picture 8).
The current liquidity ratio (the relation of the amount of current assets to short-term liabilities) shows the sufficiency of company’s funds for repayment of its short-term liabilities.
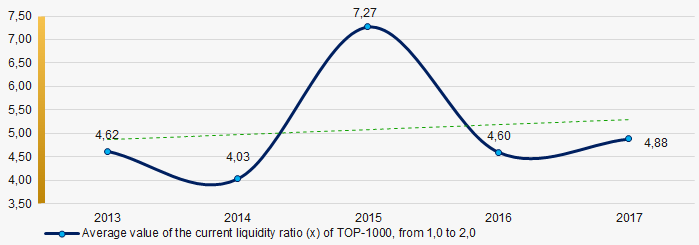 Picture 8. Change in the average values of the current liquidity ratio of TOP-1000 companies in 2013 – 2017
Sufficiently high level of average values of the indicators of the return on investment ratio with decreasing tendency has been observed for five years (Picture 9).
The ratio is calculated as the relation of net profit to the sum of own capital and long-term liabilities and demonstrates the return on the equity involved in the commercial activity of own capital and the long-term borrowed funds of an organization.
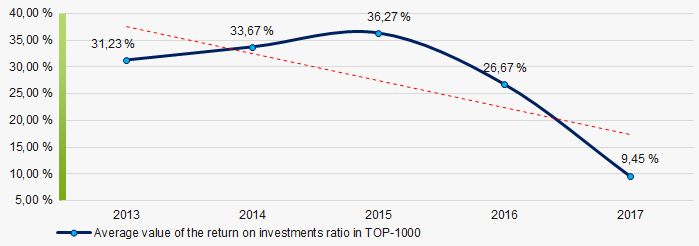 Picture 9. Change in the average values of the return on investment ratio of TOP-1000 companies in 2013 – 2017
Asset turnover ratio is calculated as the relation of sales revenue to the average value of total assets for a period and characterizes the efficiency of use of all available resources, regardless of the sources of their attraction. The ratio shows how many times a year a complete cycle of production and circulation is made, yielding profit.
This business activity ratio showed a tendency to decrease for a five-year period (Picture 10).
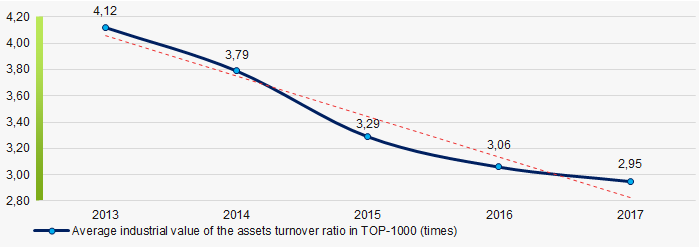 Picture 10. Change in the average values of the assets turnover ratio of TOP-1000 companies in 2013 – 2017
Production structure
The largest share in the total revenue of TOP-1000 is owned by companies, specializing in wholesale and manufacture of food products (Picture 11).
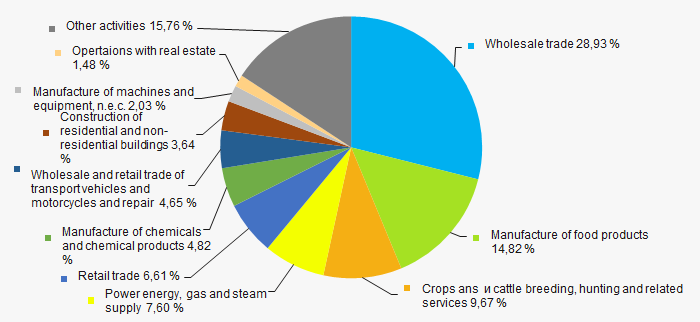 Picture 11. Распределение видов деятельности в суммарной выручке компаний ТОП-1000
73% of TOP-1000 companies are registered in the Register of small and medium enterprises of the Federal Tax Service of the RF. Besides, share of the companies in the total revenue of TOP-1000 amounts to 31% that is above the average indicator for the country (Picture 12).
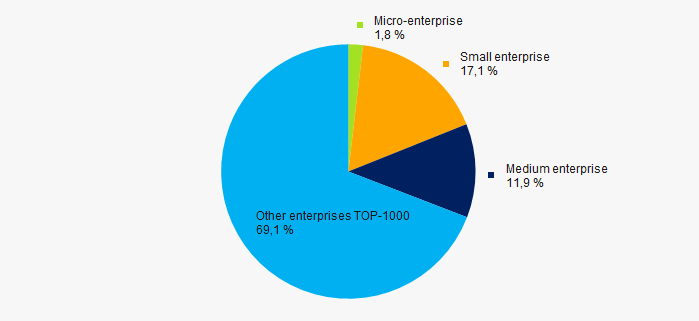 Picture 12. Shares of small and medium enterprises in TOP-1000 companies
Main regions of activities
TOP -1000 companies are unequally distributed on Voronezh region territory and registered in 34 districts. 70% of the largest companies in terms of revenue volume are concentrated in the center of Voronezh region – Voronezh city (Picture 13).
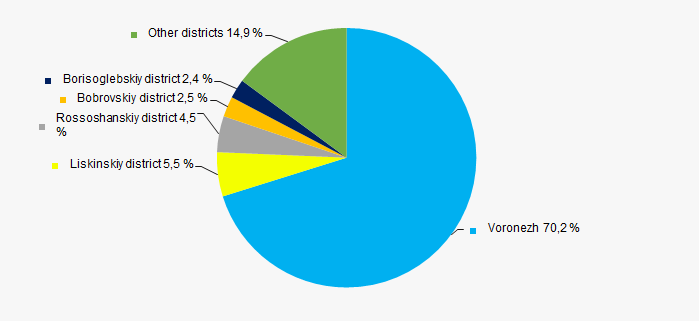 Picture 13. Distribution of TOP-1000 companies by districts of Voronezh region
Financial position score
An assessment of the financial position of TOP-1000 companies shows that the largest number is in stable and an above the average financial position. (Picture 14).
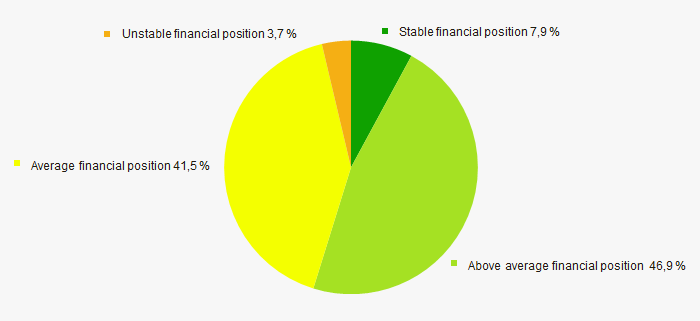 Picture 14. Distribution of TOP-1000 companies by financial position score
Solvency index Globas
Most of TOP-1000 companies have got from Medium to Superior Solvency index Globas, that points to their ability to repay their debts in time and fully (Picture 15).
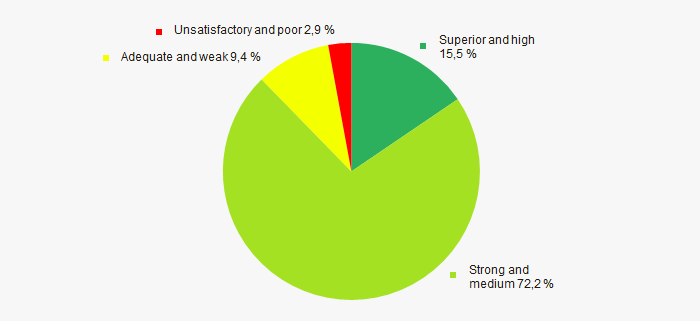 Picture 15. Distribution of TOP-1000 companies by solvency index Globas
Industrial production index
According to the data from the Federal State Statistics Service, during 12 months of 2018 increasing tendency is observed for the industrial production index of the enterprises of Voronezh region (Picture 16). Besides, the average indicator of index from month to month amounted to 96,5%.
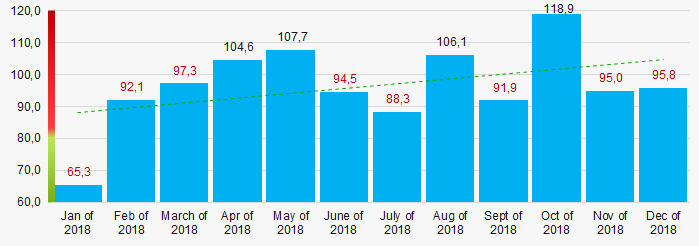 Picture 16. Industrial production index of manufacture of the enterprises of Voronezh region in 2018, month to month (%)
 According to the same data, share of the enterprises of Voronezh region in revenue volume from sale of goods, products, works services countrywide for 2018 was 0,62%.
Conclusion
Comprehensive assessment of the activity of largest real economy enterprises of Voronezh region, taking into account the main indexes, financial indicators and ratios, demonstrates the presence of favorable trends (Table 2).
| Trends and assessment factors for TOP-1000 | Share of factor, % |
| Rate of increase (decrease) of average amount of net assets | |
| Increase / decrease of share of companies with negative values of net assets | |
| Level of capital concentration | |
| Increase (decrease) rate of average revenue amount | |
| Increase (decrease) rate of average net profit (loss) amount | |
| Increase / decrease of average net profit amount of TOP-1000 companies | |
| Increase / decrease of average net loss amount of TOP-1000 companies | |
| Increase / decrease of average industrial values of the current liquidity ratio | |
| Increase / decrease of average industrial values of the return on investments ratio | |
| Increase / decrease of average industrial values of the assets turnover ratio, times | |
| Share of small and medium enterprises in the industry in terms of revenue volume more than 22% | |
| Regional concentration | |
| Financial position (major share) | |
| Solvency index Globas (major share) | |
| Industrial production index | |
| Average value of factors | |
![]() — positive trend (factor),
— positive trend (factor), ![]() — negative trend (factor).
— negative trend (factor).