
Order a report
Custom-made industry research, company ratings, competitor analysis


First results of antismoking law
Cumulative output of the manufacture of tobacco products in Russia for January-November 2013 was 353 bln pieces, that is by 6% less than for the similar period of 2012. According to the forecasts of the experts of Credinform, the output of tobacco products in Russia will reach 386 bln pieces in 2014.
In 2013 the rates of excise duties on tobacco products went up by record 40%, while in previous years the tax was increasing by an average of 10% per annum. As the result the excise duty on a pack of cigarettes increased from 7 to 10 RUB. The Russian market of tobacco products responded immediately to such changes by the drop in production.
The increase of the rate of excise duties on tobacco products is in the plan of antismoking campaign of the government. The rates of excise duty on cigarettes for 2014-2016 were enacted by the State Duma. So, for example in 2014 it is planned the growth of excise duties by 42% in relation to 2013, in 2015 – by 20% in relation to 2014, in 2016 – by 28% in relation to 2015.
In fight for the health of the nation the deputies referred to international practice in solution of this serious problem, and increase of excise duties is only one of measures. The practice shows that the rise in price for «harmful products» is one of the most viable mechanisms in the fight against it. In December 2013 the average price for cigarettes of foreign brands went up in Russia by 18% in relation to December 2012 and made 61 RUB per pack, filtered cigarettes of domestic brands rose by 31% and their price reached the level of 37 RUB per pack. However, as of today the cigarette price in Russia remains one of the lowest in Europe and Asia. Excises lower than by us are only in Kazakhstan and Belarus.
According to the experts of Credinform, in 2013 the reduction in Russian tobacco market volume in physical terms by 6% was followed by its increase in monetary terms by 2%. At year-end 2013 the market volume was 384 bln pieces or 1134 bln RUB.
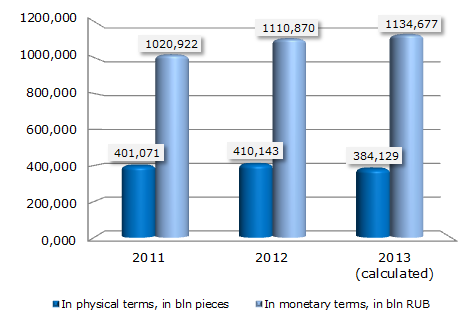
Diagram. Russian tobacco market volume in physical and monetary terms
Within the antismoking campaign a Federal law «About health protection of citizens from influence of a surrounding tobacco smoke and consequences of consumption of tobacco» came into effect on the 1st of June 2013. According to this law, it is forbidden to smoke practically in all public places (in offices, schools and higher education institutes, hospitals, fitness centers, any government agencies, on beaches, children's playgrounds etc.). There are also penalties for smoking in no smoking areas prescribed in the law: so the penalty for smoking on the territory of a hospital is at the rate of 1 000 RUB, and for smoking on a children's playground – of 3 000 RUB.
According to the antismoking law, any advertising of tobacco products is prohibited now, including sponsorship and giveaway cigarettes (promotion activities). Such innovations – these are the first steps towards so called «blind market», i.e. prohibition not only of advertising, but also the appearance of products in the shop windows. Since June 2014 a buyer will be able to take a look at the assortment of tobacco products in a sales outlet only in the tobacco price list, all tobacco products will disappear from the shop windows. Some European countries have taken things a step and banned the branding of tobacco products. So, for example the government of the Great Britain is planning to sell cigarettes in similar packs already by the year 2015, without logos and brands.
But the manufacturers are also on the move. One of the world leasers of tobacco market «Philip Morris International» is going to start selling cigarettes under its flagship name brand «Philip Morris» in Russia, which will replace the trademark «Soyuz Apollon» in the company's portfolio. It is assumed firstly to lead the diagnostic sales in Naberezhnye Chelny, and by keeping of loyalty to the production in the region under test it is possible to restart selling in the federal scale.
Main cigarettes manufacturers in the world are the USA, China and Great Britain. In Russia the large factories producing cigarettes belong mainly to international tobacco corporations. How will their financial standing be changed with the enactment of the law is difficult to say. At the present time the ten largest tobacco products manufacturers in Russia selected by the turnover got a high and the highest solvency index GLOBAS-i® by the Agency Credinform, that points at their stability and financial capability.
| № | Name, INN | Region | Turnover, in bln RUB, for 2012 | Solvency index GLOBAS-i® as of January 2014 |
|---|---|---|---|---|
| 1 | Filip Morris Izhora CJSC INN 4720007247 |
Leningrad region | 59,299 | 159 (the highest) |
| 2 | British Amerikan Tobakko-SPb CJSC INN 7809008119 |
Saint-Petersburg | 31,932 | 193 (the highest) |
| 3 | LIGGETT-DUKAT CJSC INN 7710064121 |
Moscow | 18,493 | 207 (high) |
| 4 | FILIP MORRIS KUBAN JSC INN 2311010485 |
Krasnodar Territory | 9,912 | 231 (high) |
| 5 | DonskoytabakJSC INN 6163012571 |
Rostov region | 8,927 | 201 (high) |
| 6 | Imperial Tobakko Volga LLC INN 3443033593 |
Volgograd region | 8,012 | 202 (high) |
| 7 | Kres Neva LLC INN 4720011412 |
Leningrad region | 3,886 | 204 (high) |
| 8 | Imperial Tobakko Yaroslavl CJSC INN 7601000015 |
Yaroslavl region | 3,241 | 212 (high) |
| 9 | DonskoytabakCJSC INN 6162063051 |
Rostov region | 3,079 | 247 (high) |
| 10 | Pogarskaya sigaretno - sigarnaya fabrika JSC INN 3223000539 |
Bryansk region | 1,460 | 259 (high) |
In spite of, certainly, good aims, which the deputies pursue introducing such harsh laws for tobacco market, many experts note that sharp increase in the rates of excise duties could lead to the increase in volume of the illegal tobacco market. Today according to experts’ estimates, the illegal tobacco market makes about 2%, and in some regions it reaches 6-8%. The difference in prices for cigarettes in the countries of Custom Union also promotes development of so called "grey" market of tobacco.
Most of tobacco-dependent consumers live in China, Yemen, Cambodia and Djibouti. According to the data of Rosstat, the amount of tobacco users has not changed for the last two years: both before the passage of the antismoking law in 2011 and after its passage in 2013 their share in Russia was 24%. However just two years – it is a too short term for conclusions about the effectiveness of introduced changes.