
Order a report
Custom-made industry research, company ratings, competitor analysis


Business loans paid off
Increase in business credits volume inspires to give optimistic conclusions about economic recovery. Started in 2016, recovery of business credit market was preserved during the first months of 2019.
Extension of credit portfolio does not have impact on the ability of organizations to service old debts: according to the Central Bank of Russia, dynamics of total scheduled credit debts is 4 times lower than growth of new loans in 2019, that means that companies pay credits in advance. At the same time decrease in share of overdue payment of debts is observed.
Business loans volume has significantly grown in Russia
Volume of Russian business credits provided by domestic banks is at its height: according to the data of the Central Bank of Russia for 2018, banks provided organizations and individual entrepreneurs with loans for amount over 45 trillion RUB, that is on 17% higher than in previous year. That amount includes small and medium enterprises (SME) provided with loans for amount of 6,8 trillion RUB.
Following the results of the first four months of 2019, slight reduction of credits growth rate is observed: during January-April of 2019 companies attracted 15,5 trillion RUB of borrowed funds, including SME – 2,4 trillion RUB. Growth rate amounted to 16,3% in comparison to the similar period of 2018. Macroeconomic factors were crucial for this growth rate: VAT increase had impact on decrease in consumers` demand by relatively low inflation rates.
Such quick positive dynamics has not been observed since 2013 (s. picture 1). If this tendency is preserved, at the end of 2019 increase in provided loans amount up to 50-52 trillion RUB or about 46% of GDP can be expected.
Recovery of business credit market shows overcoming of investment pause. Companies begin to revolve basic funds, invest in increase of sales, marketing, production development.
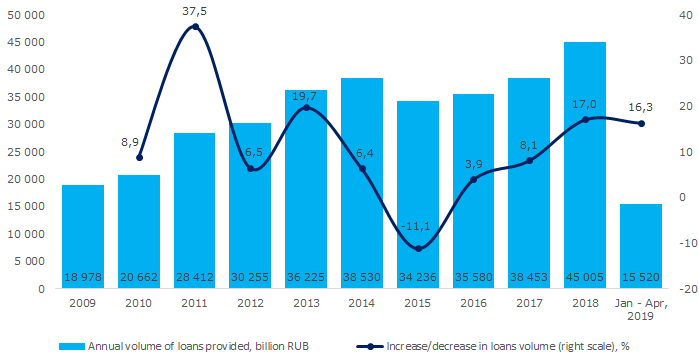 Picture 1. Total volume of business loans provided for the period, lending dynamics
Companies pay off provided loans earlier
Increase in debts of organizations on earlier provided borrowed funds is several times lower than the increase in new loans rate. Total scheduled debts in business credits amounted to 31,8 trillion RUB on May 1, 2019. Compared to the similar period of 2018, planned debts have on 4,2% increased, that is 4 times lower than growth rate of new loans for January-April of 2019. (s. pictures 1-2). Thus, companies, obtaining new loans, do not forget to pay previous debts to the banks.
Stabilization of overdue debts share is outlined: it did not exceed 7,1% of the total loan debts share on May 1, 2019. According to the Central Bank of Russia, maximum overdue share, since 2009, was 7,5% – on September 1, 2016. The lower overdue debts share is, the fewer companies face financial difficulties and inability to service credit obligations.
 Picture 2. Scheduled debts on credits on May, 1 of every year, debts dynamics
Companies of Moscow collect 39% of business scheduled debts on credits
The largest amount of borrowed funds was collected by the companies and individual entrepreneurs from Moscow – 12,5 trillion RUB on May 1, 2019, overdue debt share amounted to 7,4%. They are followed by organizations from Saint-Petersburg – 2,2 trillion RUB and Moscow region – 2,1 trillion RUB.
Entrepreneurs from Saint-Petersburg have got the smallest overdue debt share out of the top-3 group - 6,3%. Among Top-10 regions with the largest debts amount on credits the companies of the Yamal-Nenets Autonomous District have the smallest overdue debts share – 0,9%.
Table 1. Top-10 regions with the largest scheduled debts on credits of legal entities and individual entrepreneurs, on May 1, 2019.
| Rank | Subject | Debts on credits, billion RUB | Overdue debt share, % |
| 1 | Moscow | 12 455 | 7.4 |
| 2 | Saint-Petersburg | 2 218 | 6.3 |
| 3 | Moscow region | 2 149 | 7.8 |
| 4 | Krasnodar territory | 1 078 | 5.8 |
| 5 | Sverdlovsk region | 1 010 | 3.0 |
| 6 | Krasnoyarsk territory | 767 | 2.7 |
| 7 | Yamal-Nenets AD | 741 | 0.9 |
| 8 | The Republic of Tatarstan | 652 | 3.9 |
| 9 | Kemerovo region - Kuzbass | 544 | 6.2 |
| 10 | Chelyabinsk region | 536 | 5.8 |
| Top-10 subjects of the RF | 22 151 | 6.5 | |
| Other 75 subjects of the RF | 9 736 | 8.5 | |
| Total for the RF | 31 887 | 7.1 | |
Companies of the Yamal-Nenets Autonomous District and the North Caucasus Republics have got the largest overdue loans share
Taking into consideration overdue debt share on credits, financial state of companies in general in one particular region can be analyzed. The most unfavorable business environment is in the Yamal-Nenets Autonomous District, where 97,8% of debts were overdue on May 1, 2019. Large share of overdue debts in rich in resources region can be explained by small amount of active companies, when even one debtor can influence the statistics.
They are followed by organizations from the Republics of Dagestan and Ingushetia. In these regions overdue debts share on credits 69,2% and 66,8% correspondingly, that reflects unsatisfactory level of social and economic development (s. table 2).
Table 2. Top-10 regions with the largest overdue debts of legal entities and individual entrepreneurs on credits, on May 1, 2019.
| Rank | Subject | Debts on credits, billion RUB | Overdue debt share, % |
| 1 | Nenets AD | 12 | 97,9 |
| 2 | The Republic of Dagestan | 33 | 69,2 |
| 3 | The Republic of Ingushetia | 2 | 66,8 |
| 4 | The Kabardino-Balkar Republic | 34 | 62,2 |
| 5 | The Republic of Kalmykia | 6 | 41,9 |
| 6 | Altay Territory | 115 | 35,3 |
| 7 | The Republic of Komi | 39 | 30,8 |
| 8 | The Republic of Altay | 12 | 24,9 |
| 9 | The Republic of North Osetia – Alania | 11 | 23,1 |
| 10 | Kaluga region | 159 | 20,5 |
| Total for the RF | 31 887 | 7.1 | |
Conclusion
In spite of low rates of GDP that amounted to 0,5% in the Q1 of 2019, Russian banks increase volume of business credits fast, that shows stabilization of macroeconomic situation in the country and beginning of new investment wave. It was not to be expected under conditions of economic slowdown when credit provision is reducing. Interest rate cut by the Central Bank of Russia to 7,5% from June 17, 2019 gives a cue to entrepreneurs for further easing of loans. Credit portfolio of the majority of companies is not crucial for stable financial state, overdue debts share on credits is slowly decreasing. Newly attracted funds at a rational use can promote development of companies and recovery of Russian economy.