
Order a report
Custom-made industry research, company ratings, competitor analysis


Quick ratio of footwear manuracturers
Information agency Credinform has prepared a ranking of the largest Russian footwear manufacturers. Companies with the largest annual revenue (Top-10) were selected for the ranking, according to the data from the Statistical Register for the latest available accounting periods (2015 - 2017). Then they were ranked by quick ratio (Table 1). The analysis was based on the data from the Information and Analytical system Globas.
Quick ratio (x) characterizes company’s solvency in the short and medium term. The indicator is illustrative of the possibility of an enterprise to repay its short-term liabilities by its most liquid assets: cash, short-term receivables and short-term financial investment. Recommended value of the ratio is from 0,5 to 0,8.
Too high ratio value may indicate irrational capital structure. It may be connected with a slow turnover of funds invested in stocks and an increase in accounts receivable. A low level of the indicator means that the funds and the upcoming income from current operations do not cover company’s current liabilities.
For getting of the most comprehensive and fair picture of the financial standing of an enterprise it is necessary to pay attention to all indicators and financial ratios.
| Name, INN, region | Sales revenue, million RUB | Net profit (loss), million RUB | Quick ratio (x), from 0,5 to 0,8 | Solvency index Globas | |||
| 2016 | 2017 | 2016 | 2017 | 2016 | 2017 | ||
| 1 | 2 | 3 | 4 | 5 | 6 | 7 | 8 |
| NJSC EGORJEVSK-SHOES INN 5011017647 Moscow region |
|
|
|
|
|
|
156 Superior |
| NJSC PTK MODERAM INN 7816057195 Saint Petersburg |
|
|
|
|
|
|
214 Strong |
| STEPTRADE LLC INN 6901034920 Tver region |
|
|
|
|
|
|
273 Medium |
| NJSC PARITET INN 5020080885 Moscow region |
|
|
|
|
|
|
236 Strong |
| NJSC Moscow Footwear Factory Paris Commune INN 7705032967 Moscow |
|
|
|
|
|
|
237 Strong |
| NJSC Ralf Ringer INN 7718160370 Moscow |
|
|
|
|
|
|
205 Strong |
| AVANGARD SAFETY GROUP LLC INN 7721753959 Moscow |
|
|
|
|
|
|
249 Strong |
| PF LEL LLC INN 4329004775 Kirov region |
|
|
|
|
|
|
175 High |
| NJSC FOOTWEAR FIRM UNICHEL INN 7448008453 Chelyabinsk region |
|
|
|
|
|
|
184 High |
| BRIS-BOSFOR LLC INN 7705344035 Krasnodar territory Bankruptcy claim was filed against the company |
|
|
|
|
|
|
350 Adequate |
| Total for Top-10 companies | |
|
|
|
|||
| Average for Top-10 companies | |
|
|
|
|
|
|
| Average industry value | |
|
|
|
|
|
|
![]() — improvement compared to prior period,
— improvement compared to prior period, ![]() — decline compared to prior period.
— decline compared to prior period.
Average value of quick ratio of Top-10 companies is much higher than the average industry one. In 2017 no company had this ratio within the recommended values.
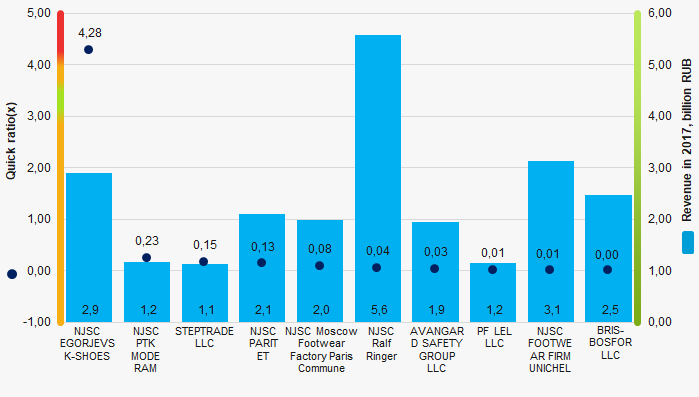 Picture 1. Quick ratio and revenue of the largest Russian footwear manufacturers (Top-10)
During the decade average industry quick ratio tended to decrease (Picture 2).
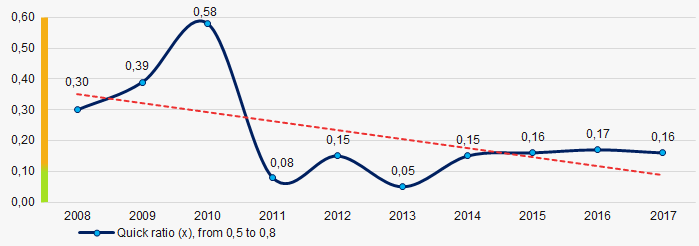 Picture 2. Change in average industry quick ratio of Russian footwear manufacturers in 2008 – 2017