The Russian industry touched the bottom
Following the decline in economic activity and deterioration of macroeconomic conditions (ruble devaluation, bad situation on the commodity markets, high inflation expectations and borrowing rate, sanctions), the significant drop in output is recorded.
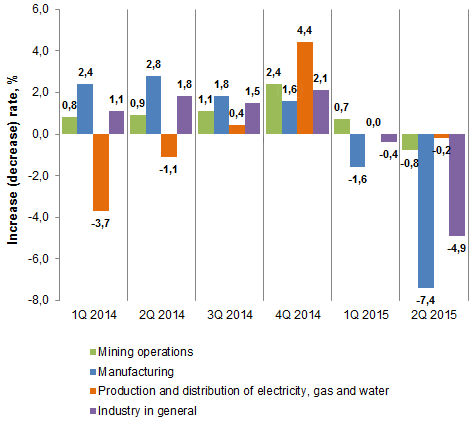
The negative dynamics in January-July 2015 compared with January-July 2014 amounted to -3.0%, while the negative developments in the II quarter have intensified: the industry in general fell by 4.9% and manufacturing by 7, 4% over the same period in 2014.
Active consumer demand, which was observed at the end of 2014 (against the national currency upswing), has run low and cannot be the growth driver. On the contrary, today the Russians’ expenses developed, at best, into delayed demand, and in fact are falling following the accrued wages depreciation.
Dynamics of industrial output to the corresponding period of last year, %

Looking at the industry sectors, a positive thing is observed: there are segments that show good growth rates. These include leather production (the growth for the 1st year half was 36%), steel-making equipment (35.7%), canned vegetables (27.6%), cheese (25.7%) etc. (See Table 1).
| № | Commodity group | January-July 2015 in % to January-July 2014 |
|---|---|---|
| 1 | Patent leather and patent laminated leather | 36,0 |
| 2 | Steel-making equipment, casting machines | 35,7 |
| 3 | Counters of production and consumption of the liquid | 31,6 |
| 4 | Canned vegetables and mushrooms | 27,6 |
| 5 | Plastic materials for floor, wall and ceiling covering | 26,1 |
| 6 | Cheese and cheese products | 25,7 |
| 7 | Sheet cast, rolled, drawn and blown glass | 19,7 |
| 8 | Jams, jellies, compotes, fruit and berry puree | 17,7 |
| 9 | Synthetic rubber | 17,5 |
| 10 | Electric motors, DC generators | 17,3 |
On the other hand, there are sectors where the situation is critical (see Table 2): the production of passenger cars decreased by 65.7%; internal combustion engines by 37.3%. That indicates the crisis in the automotive retail sector.
| № | Commodity group | January-July 2015 in % to January-July 2014 |
|---|---|---|
| 1 | Cardboard boxes (transport container) | -65,7 |
| 2 | Mainline passenger cars | -64,7 |
| 3 | Sliced veneer | -60,3 |
| 4 | Men’s trousers | -56,9 |
| 5 | Warm jackets | -55,6 |
| 6 | Mainline freight cars | -54,0 |
| 7 | TV receiving equipment | -40,3 |
| 8 | Golden and silver chains | -40,0 |
| 9 | Copper bars and sections | -39,4 |
| 10 | Internal combustion engines | -37,3 |
Since the inertia is usual for the economic processes, the impact of negative business conditions and fall of consumer demand will be particularly noticeable in the second half of the year. Yet there is no reason to expect the industrial growth recovery. And the events of the second half of August (problems in the Chinese economy, triggering a collapse in international markets) points out a possible sprouting of economic crisis on the top countries of the world.
It is noteworthy that the policy of import substitution initiated by the government, as well as sanctions restrictions on a number of goods from the EU and the United States brought the results: for example, the production of cheese in the 1st year half increased by 25.7%, which will have a positive impact on our food security. With reasonable approach, devaluation of the ruble can be used as an impetus for the industry to domestic counterparts (the development of new industries), and export-oriented companies to sweep new markets.
Solvency ratio of oil and gas industry
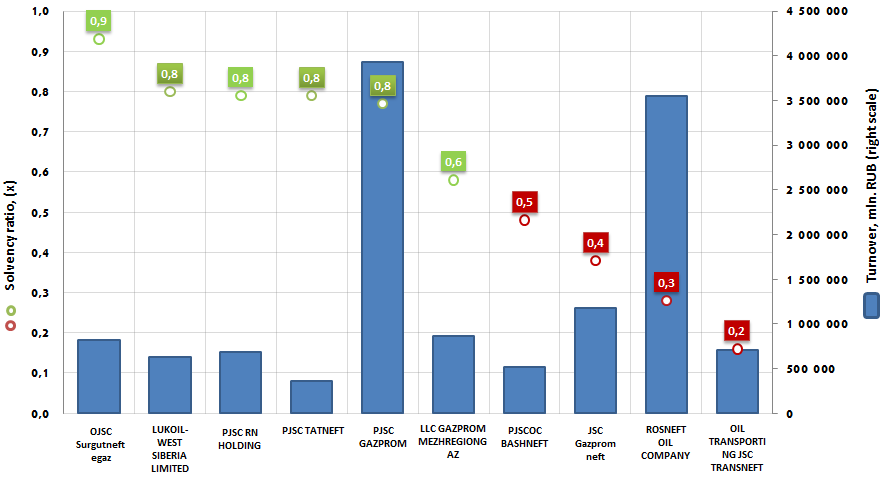
Information agency Credinform prepared a ranking of companies in oil and gas industry.
Companies with the highest volume of revenue were selected for this ranking according to the data from the Statistical Register for the latest available period (for the year 2013). The enterprises were ranked by decrease in solvency ratio.
The solvency ratio (x) is equity capital to total assets. It indicates the dependence of the company on external loans.
The recommended value is >0,5.
The lower value shoes the dependence on external sources of financing and possible instability therefore.
However, sometimes the companies are able to be stable with the value lower than 0,5. They are first of all companies with high assets turnover, stable demand, established supply and distribution channels, low fixed costs (for example, trade and intermediary organizations).
The value of the solvency ratio above the optimum level indicates a high solvency.
The recognition of the company insolvent does not mean the business is automatically determined as pre-bankruptcy organizations. This is just a recorded financial instability. Therefore, the regulatory value of the criteria is established in such a way as to provide operational control of the entity's financial position and to implement the insolvency prevention measures in advance, as well as to stimulate the company for self-getting out the crisis.
For the most comprehensive and fair view on the company’s financial condition it is necessary to pay attention not only to the average values in the industry, but also to the whole presented set of financial indicators and ratios.
| № | Name | Region | Revenue, mln. RUB, 2013 г. | Solvency ratio, (х) | Solvency index GLOBAS-i® |
|---|---|---|---|---|---|
| 1 | SURGUTNEFTEGAS OPEN JOINT STOCK COMPANY INN 8602060555 |
the Khanty-Mansi Autonomous Okrug - Yugra | 814 187,8 | 0,9 | 189 the highest |
| 2 | LUKOIL-WEST SIBERIA LIMITED INN 8608048498 |
the Khanty-Mansi Autonomous Okrug - Yugra | 631 009,8 | 0,8 | 187 the highest |
| 3 | PJSC RN Holding INN 7225004092 |
the Tyumen region | 688 008,2 | 0,8 | 253 high |
| 4 | PJSC «Tatneft» INN 1644003838 |
the Republic of Tatarstan | 363 531,3 | 0,8 | 185 the highest |
| 5 | PJSC GAZPROM INN 7736050003 |
Moscow | 3 933 335,3 | 0,8 | 156 the highest |
| 6 | LLC GAZPROM MEZHREGIONGAZ INN 5003021311 |
Moscow | 867 412,1 | 0,6 | 251 high |
| 7 | PJSOC Bashneft INN 0274051582 |
the Republic of Bashkortostan | 517 486,7 | 0,5 | 196 the highest |
| 8 | JSC Gazprom Neft INN 5504036333 |
Saint-Petersburg | 1 178 063,8 | 0,4 | 188 the highest |
| 9 | ROSNEFT OIL COMPANY INN 7706107510 |
Moscow | 3 544 443,1 | 0,3 | 209 high |
| 10 | OIL TRANSPORTING JOINT STOCK COMPANY TRANSNEFT INN 7706061801 |
Moscow | 704 714,0 | 0,2 | 166 the highest |
