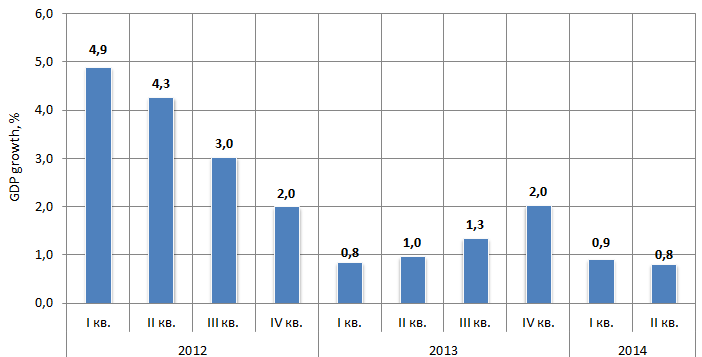
GDP growth in the 2nd quarter of 2014 amounted 0.8% that is worse than the expectation of the Ministry of Economic Development and Trade with its trend of 1.1%.
Positive beginning of the year when the Russian economy demonstrated its positive figures against the 1st quarter of the last year has changed with the worsening of major national measures. The high growth rate of the industrial production due to the manufacturing branches in the 1st half of the year did not subscribe the positive speedup trend.
Russian GDP growth by quarter against the relevant period of the last year, %
The negative reversal is occasioned with the related facts. The sufficiently measurable slowdown of the public consumption is being observed that is checked out with trend reduction of the retail turnover from 3.6% in the 1st quarter to 1.8 in the 2nd quarter. The heavy as ever geopolitical environment makes Marquee Investors flesh crawl and the sanctions against Russia restrict the abroad crediting to the range of the largest companies. The economic environment is getting worse.
The retaliation measures that Russia has taken for the import ban of the essential supplies from the countries of EC, USA, Canada, Australia and Norway can give a fillip to the national agricultural industry on a long-term horizon. However, the accelerating inflation that already exceeds all the guidelines of the Government for this year should be expected near the future. The key interest raise to 8% by the Central Bank will lead to the credit tightening as well as damping the low investment activity as it is.
All that is lacking is to hope for the early settlement of the conflict in Ukraine that is hurting not only the economy of Russia, but also other states, primarily the countries of EC.
Information agency Credinform prepared a ranking of Russian manufacturers of pharmaceutical goods on product costs. The companies with the highest volume of revenue were selected for this research according to the data from the Statistical Register for the latest available period (for the year 2012). Then, the first 10 enterprises selected by turnover were ranked by decrease in the share of the costs of output in company turnover.
Product costs are costs (expenses) for manufacture of products, execution of work or provision of services. It is the most important qualitative indicator, showing how much an enterprise spends on production and distribution. The lower are product costs, the higher is profit and, accordingly, production profitability. There are no specified values for the mentioned indicator and for assessment of the efficiency of cost management it is interesting to observe, which share in company turnover is taken by product costs.
№ | Name, INN | Region | Turnover for 2012, in mln RUB | Product costs, in mln RUB | Share of product costs in turnover, (%) | Solvency index GLOBAS-i® |
---|---|---|---|---|---|---|
1 | Valenta Farmatsevtika OJSC INN 5050008117 |
Moscow region | 5 538 | 857 | 15 | 220 (high) |
2 | EVALAR CJSC INN 2227000087 |
Altai territory | 6 577 | 1 280 | 19 | 155 (the highest) |
3 | Farmstandart-Leksredstva OJSC INN 4631002737 |
Kursk region | 15 043 | 5 054 | 34 | 241 (high) |
4 | Nizhegorodsky khimiko-farmatsevtichesky zavod OJSC INN 5260900010 |
Nizhny Novgorod region | 13 900 | 6 290 | 45 | 182 (the highest) |
5 | Khimiko-farmatsevtichesky kombinat AKRIKHIN OJSC INN 5031013320 |
Moscow region | 6 961 | 3 267 | 47 | 191 (the highest) |
6 | FARMFIRMA SOTEKS CJSC INN 7715240941 |
Moscow region | 4 472 | 2 297 | 51 | 202 (high) |
7 | F-Sintez CJSC INN 5024104978 |
Moscow region | 4 220 | 3 153 | 75 | 237 (high) |
8 | SANDOZ CJSC INN 7717011640 |
Moscow | 15 596 | 12 541 | 80 | 229 (high) |
9 | FARMSTANDART-UFIMSKY VITAMINNY ZAVOD OJSC INN 0274036993 |
Republic of Bashkortostan | 24 165 | 19 466 | 81 | 176 (the highest) |
10 | MEZHREGIONALNAYA FARMATSEVTICHESKAYA PROIZVODSTVENNO-DISTRIBYUTORSKAYA KORPORATSIYA BIOTEK CJSC INN 7713047283 |
Moscow | 8 953 | - | - | 250 (high) |
The average share of product costs in turnover for Russian pharmaceutical companies makes 70%, what points to high expenses for production. Such results are a norm for knowledge-intensive industries.
The first three companies of the ranking are presented by following organizations: Valenta Farmatsevtika OJSC (15%), EVALAR CJSC (19%) and Farmstandart-Leksredstva OJSC (34%). The enterprises showed low enough values of the indicators of product costs relative to their turnover. Such result testifies to a competent approach in control of own costs. All enterprises got a high and the highest solvency index GLOBAS-i®, that characterizes it as financially stable.
Share of the cost of output in turnover of the largest manufacturers of pharmaceutical goods in Russia, TOP-10
Three from TOP-10 companies showed the indicator value above the industry average value: F-Sintez CJSC (75%), SANDOZ CJSC (80%) and FARMSTANDART-UFIMSKY VITAMINNY ZAVOD OJSC (81%). These enterprises should approach to the control of own costs more rationally. However, considering the combination of both financial and non-financial indicators, all companies got a high and the highest solvency index Globas-i®.
For the company MEZHREGIONALNAYA FARMATSEVTICHESKAYA PROIZVODSTVENNO-DISTRIBYUTORSKAYA KORPORATSIYA BIOTEK CJSC the indicator value «Share of product costs in turnover» wasn’t calculated because of lack of data.