The largest transnational corporations in the Russian market
Despite sanctions and political confrontation with the West, the leading transnational companies are not in a hurry to leave the Russian market. With the exception of single cases of winding-up, they continue to build successfully their business, by opening subsidiaries or entering into the capital of domestic enterprises.
The experience of the American automaker General Motors may be used as a negative example: after 20 years of presence in our market the management decided to wind down its operations and mothball the car manufacturing plant, referring to sanctions risks and a sharp decline in sales. At the same time, other the largest American corporations, such as Ford Motor or General Electric, were not afraid of possible difficulties and do not abandon investment plans.
In total, Russia employs currently more than 63,000 real sector companies with foreign participation in the capital, that proves once again the active integration of the domestic economy into the global market. Moreover, the largest organization of world economies are developing their production sites - 10 enterprises from Top-50 companies in terms of global revenue, directly owning subsidiaries not only around the world, but also in the RF.
| № | Company, headquarters | Main activity | Revenue, bln USD, for 2017 | Position in the world ranking by revenue, 2017 | Number of registered subsidiaries directly owned, worldwide | Number of subsidiaries directly owned, in Russia |
| 1 | Royal Dutch Shell Great Britain |
Crude oil and natural gas production | 305.4 | 6 | 1244 | 6 |
| 2 | Volkswagen Germany |
Manufacture of motor vehicles | 287.9 | 8 | 1010 | 11 |
| 3 | BP Great Britain |
Manufacture of petrochemical product | 240.6 | 9 | 915 | 3 |
| 4 | Exxon Mobil Corp USA |
Manufacture of petrochemical product | 237.2 | 10 | 351 | 1 |
| 5 | Daimler Germany |
Manufacture of motor vehicles | 200.0 | 14 | 527 | 9 |
| 6 | Ford Motor USA |
Manufacture of motor vehicles | 156.8 | 20 | 140 | 1 |
| 7 | Samsung Electronics Republic of Korea |
Manufacture of electronic parts and devices | 151.3 | 24 | 230 | 6 |
| 8 | Total France |
Добыча сырой нефти и природного газа | 149.3 | 25 | 1009 | 9 |
| 9 | General Electric Company USA |
Manufacture of industrial equipment, engines, electric turbines | 120.5 | 38 | 797 | 2 |
| 10 | Toyota Motor Corporation Japan |
Manufacture of motor vehicles | 114.9 | 43 | 564 | 3 |
The range of interests of foreign corporate investment is very wide - development of deposits, hydrocarbon production, automotive industry, power engineering, petrochemical industry, consulting, banking services (s. Table 2).
| № | Company | Short project description |
| 1 | Royal Dutch Shell | - Development of deposits on the shelf of Sakhalin Island, development of the Salym group of oil fields (KhMAD-Yugra), as well as participation in the Caspian Pipeline Consortium. - Network of petrol stations «Shell». - Complex for the production of lubricants «Shell» in Torzhok, sale of petrochemical products. - Consulting services. |
| 2 | Volkswagen | - Plant for manufacture of Volkswagen Tiguan, Volkswagen Polo and ŠKODA Rapid in Kaluga. - Plant for the production of automobile engines in Kaluga. - Plant for manufacture of Volkswagen Jetta, ŠKODA OCTAVIA and ŠKODA KODIAQ in Nizhny Novgorod. |
| 3 | BP | - Development of the Srednebotuobinsky oil and gas condensate field (the Republic of Yakutia). - Exploration works in Western Siberia and the Yenisei-Khatanga basin with a total area of about 260 000 km2, drilling. - Joint project with Oil company «Rosneft» on the development of subsoil of the Yamal-Nenets Autonomous District within the Kharampursky and Festivalny licensed areas with total geological reserves of more than 880 bln m3 of gas. |
| 4 | Exxon Mobil Corp | - Exploration and development of the project Sakhalin-1. - Sale and marketing of motor oils «Mobil 1», «Mobil Delvac 1» and «Mobil SHC»; ale of petrochemical products. - Participation in the Caspian Pipeline Consortium. |
| 5 | Daimler | - Production of trucks Mercedes-Benz Sprinter Classic at the plant «GAZ as well as diesel engines for them in Yaroslavl. - Construction of a factory for the production of Mersedes Benz cars. |
| 6 | Ford Motor | - Plant for manufacture of Ford Focus and Ford Mondeo in Vsevolozhsk (Leningrad region). - Plant for manufacture of Ford Explorer, Ford Kuga and Ford Transit plant for production of engines in Yelabuga (Tatarstan). - Plant for manufacture of Ford Fiesta и Ford EcoSport in Naberezhnye Chelny (Tatarstan). |
| 7 | Samsung Electronics | - Factory for the production of TVs, washing machines, monitors Samsung Electronics in Kaluga region. |
| 8 | Total | - Oil extraction on the basis of a production sharing agreement (PSA) at the Kharyaga oil field (Nenets Autonomous District). - Participation in the project «Yamal-LNG» and development of Termokarstovoye gas field in the Yamal-Nenets Autonomous District. - Construction of a plant for the production of lubricants in the Kaluga region. |
| 9 | General Electric Company | - Joint production, assembly, sale and servicing of high-performance industrial gas-fired plants in Rybinsk (Yaroslavl region). |
| 10 | Toyota Motor Corporation | - Plant for manufacture of Toyota Camry and RAV4 in St. Petersburg.. - Banking activity - Toyota Bank JSC. |
Russia is too important market to abandon it. Our country remains a focus area for transnational corporations, despite all difficulties and uncertainties that arose due to the situation in Ukraine. A great many is ready to open a business here, renew or expand existing facilities, as well as create new workplaces, that points to the confidence in the economic prospects, trust gained over many years. The Western Europe and United States remains the main investors in the Russian economy, that confirms the presence of a wide range of subsidiaries.
Dependence on loans of mining companies
Information agency Credinform has prepared a ranking of the largest Russian mining companies. The largest enterprises (TOP-10 and TOP-1000) in terms of annual revenue were selected according to the data from the Statistical Register for the last accounting periods (2014 - 2017). Then the companies were ranged by solvency ratio (Table 1). The analysis was based on the data from the Information and Analytical system Globas.
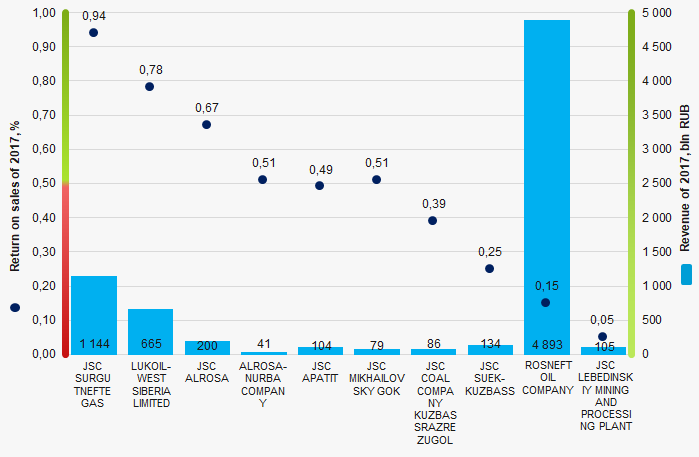
Solvency ratio (x) is calculated as a ratio of shareholders’ equity to total assets and shows the dependence of the company on external loans. The recommended value of the ratio is >0.5. The ratio value less than minimum limit demostrates strong dependence on external sources of funds; such dependence may lead to liquidity crisis, unstable financial position in case of economic downturn.
The calculation of practical values of financial indicators, which might be considered as normal for a certain industry, has been developed and implemented in the Information and Analytical system Globas by the experts of the Information Agency Credinform, taking into account the actual situation of the economy as a whole and the industries. In 2016 the practical value of solvency ratio for extracting companies is from 0,01 to 0,83 at average (look for details at Table 1).
For the most full and fair opinion about the company’s financial position the whole set of financial indicators and ratios should be taken into account.
| Name, INN, region, main activity | Revenue, bln RUB | Net profit, bln RUB | Solvency ratio (x), >0,5 | Solvency index Globas 2017-2018 | |||
| 2016 | 2017 | 2016 | 2017 | 2016 | 2017 | ||
| 1 | 2 | 3 | 4 | 5 | 6 | 7 | 8 |
| JSC SURGUTNEFTEGAS INN 8602060555 Khanty-Mansiysk Autonomous District - Yugra Crude oil mining |  993 993 |
 1144 1144 |
 -105 -105 |
 150 150 |
 0.95 0.95 |
 0.94 0.94 |
182 High |
| LUKOIL-WEST SIBERIA LIMITED INN 8608048498 Khanty-Mansiysk Autonomous District - Yugra Crude oil mining |  9602 9602 |
 665 665 |
 77 77 |
 70 70 |
 0.80 0.80 |
 0.78 0.78 |
172 Superior |
| JSC ALROSA INN 1433000147 The Sakha (Yakutia) Republic Diamonds mining |  250 250 |
 200 200 |
 149 149 |
 17 17 |
 0.64 0.64 |
 0.67 0.67 |
200 Strong |
| ALROSA-NURBA COMPANY INN 1419003844 The Sakha (Yakutia) Republic Diamonds mining |  47 47 |
 41 41 |
 18 18 |
 13 13 |
 0.58 0.58 |
 0.51 0.51 |
202 Strong |
| JSC APATIT INN 5103070023 Vologda region Mining of mineral raw materials for chemical industry and manufacture of mineral fertilizers |  103 103 |
 104 104 |
 37 37 |
 21 21 |
 0.53 0.53 |
 0.49 0.49 |
216 Strong |
| JSC MIKHAILOVSKY GOK INN 4633001577 Kursk region Open pit mining of iron ores |  57 57 |
 79 79 |
 15 15 |
 27 27 |
 0.46 0.46 |
 0.51 0.51 |
160 Superior |
| JSC COAL COMPANY KUZBASSRAZREZUGOL INN 4205049090 Kemerovo region Open pit coal mining, except for anthracite, close-burning coal and brown coal |  69 69 |
 86 86 |
 3 3 |
 10 10 |
 0.37 0.37 |
 0.39 0.39 |
212 Strong |
| JSC SUEK-KUZBASS INN 4212024138 Kemerovo region Coal mining, except for anthracite, close-burning coal and brown coal by underground method |  106 106 |
 134 134 |
 22 22 |
 30 30 |
 0.30 0.30 |
 0.25 0.25 |
203 Strong |
| ROSNEFT OIL COMPANY INN 7706107510 Moscow Crude oil mining |  3930 3930 |
 4893 4893 |
 99 99 |
 139 139 |
 0.15 0.15 |
 0.15 0.15 |
195 High |
| JSC LEBEDINSKIY MINING AND PROCESSING PLANT INN 3127000014 Belgorod region Open pit coal mining of iron ores |  74 74 |
 105 105 |
 101 101 |
 51 51 |
 0.12 0.12 |
 0.05 0.05 |
224 Strong |
| Total for TOP-10 companies |  6231 6231 |
 7451 7451 |
 416 416 |
 527 527 |
|||
| Average value for TOP-10 companies |  623 623 |
 745 745 |
 42 42 |
 53 53 |
 0.49 0.49 |
 0.47 0.47 |
|
| Average value for TOP-1000 companies |  14 14 |
 2 2 |
 0.27 0.27 |
||||
| Average industry value for coal mining |  1.7 1.7 |
 0.2 0.2 |
 0.14 0.14 |
||||
| Average industry value for oil and gas mining |  13.1 13.1 |
 1.2 1.2 |
 0.44 0.44 |
||||
| Average industry value for metallic ores mining |  1.5 1.5 |
 0.5 0.5 |
 0.46 0.46 |
||||
| Average industry value for other minerals mining |  0.128 0.128 |
 0.041 0.041 |
 0.54 0.54 |
||||
| Average industry value for mining industry |  4.107 4.107 |
 0.485 0.485 |
 0.40 0.40 |
||||
| Average industry practical value for coal mining | from -0.15 to 0.62 | ||||||
| Average industry practical value for oil and gas mining | from -0.11 to 0.80 | ||||||
| Average industry practical value for metallic ores mining | from 0.00 to 0.95 | ||||||
| Average industry practical value for other minerals mining | from -0.05 to 1.00 | ||||||
| Average industry practical value for mining industry | from -0.08 to 0.84 | ||||||
 — growth of indicator in comparison with prior period,
  — decline of indicator in comparison with prior period.
Average value of solvency ratio for TOP-10 companies is lower than recommended value and higher than average industry value and is within the interval of practical value.
 Picture 1. Solvency ratio and revenue of the largest Russian mining companies (ТОP-10)
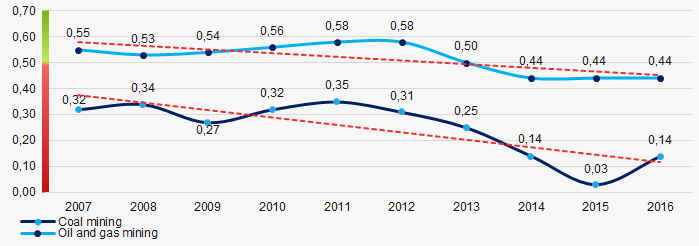
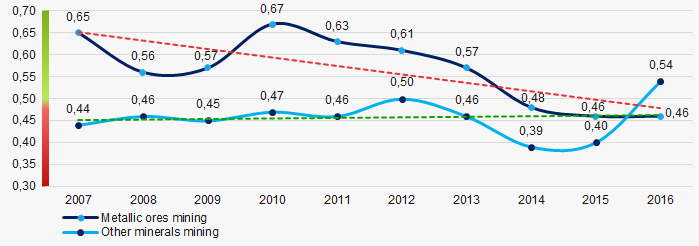
For the last 10 years, the average values of solvency ratio in mining industry showed the decreasing tendency in general. Particular growth of indicators is observed only in the sphere of other minerals mining (Picture 2 and 3).
 Picture 2. Change in average industry values of solvency ratio of Russian companies engaged in coal, oil and gas mining in 2007 — 2016
 Picture 3.Change in average industry values of solvency ratio of Russian companies engaged in metallic ores and other minerals mining in 2007 – 2016