
Order a report
Custom-made industry research, company ratings, competitor analysis


Return on assets of the largest enterprises of the real economy sector of St. Petersburg
Information agency Credinform offers a ranking of the largest enterprises of the real economy sector of St. Petersburg. The companies with the largest volume of annual revenue (TOP-1000 and TOP-10) were selected for the ranking, according to the data from the Statistical Register for the latest available periods from 2007 to 2016. Then (Table 1) they were ranked by the return on assets ratio. The analysis was made on the basis of the data of the Information and Analytical system Globas.
Return on assets (%) is calculated as the relation of the sum of net profit and interest payable to the total assets value of a company and shows how many monetary units of net profit gets every unit of total assets. The ratio characterizes the effectiveness of using by the company of all available resources and financial management. The higher is the ratio value, the more effective is business, that is the higher return per every monetary unit invested in assets.
Dynamics of this indicator should be considered. Its subsequent decrease points to the decline in the efficiency of the use of assets.
For getting of the most comprehensive and fair picture of the financial standing of an enterprise it is necessary to pay attention to all combination of indicators and financial ratios.
| Name, INN, main type of activity | Revenue, mln RUB | Net profit, mln RUB | Return on assets, % | Solvency index Globas | |||
| 2015 | 2016 | 2015 | 2016 | 2015 | 2016 | ||
| PETRO LLC INN 7834005168 Manufacture of tobacco products |
47 274,7 | 64 882,8 | 10 653,1 | 12 515,8 | 34,97 | 26,48 | 199 High |
| Baltika Breweries LLC INN 7802849641 Beer production |
86 608,4 | 90 525,2 | 12 030,9 | 14 308,2 | 11,20 | 11,70 | 183 High |
| Gazprom Neft PJSC INN 5504036333 Wholesale of solid, liquid and gaseous fuels |
1 272 981,1 | 1 233 847,8 | 16 145,8 | 122 462,2 | 1,15 | 8,34 | 180 High |
| AGROTORG LLC INN 7825706086 Other retail sale in non-specialized stores |
228 908,6 | 481 713,4 | 499,0 | 10 567,9 | 0,34 | 5,42 | 212 Strong |
| ROSSIYA AIRLINES NJSC INN 7810814522 Transportation by air passenger transport |
38 754,5 | 73 189,0 | 817,7 | 904,5 | 6,91 | 4,56 | 197 High |
| LENENERGO PJSC INN 7803002209 Transmission of electricity and technological connection to distribution networks |
43 726,7 | 61 260,1 | -5 916,5 | 7 561,3 | -3,04 | 4,01 | 205 Strong |
| GAZPROM TRANSGAZ SAINT-PETERSBURG LLC INN 7805018099 Gas transportation through pipelines |
69 248,9 | 71 687,4 | 1 223,6 | 2 032,5 | 2,43 | 3,97 | 189 High |
| O`KEY LLC INN 7826087713 Retail sale mainly of food products in non-specialized stores |
170 598,6 | 180 587,1 | 448,0 | 2 152,2 | 0,71 | 3,03 | 215 Strong |
| LONG-DISTANCE AND INTERNATIONAL TELECOMMUNICATIONS ROSTELECOM PJSC INN 7707049388 Activity in the field of communication on the basis of wire technologies |
283 169,5 | 282 684,9 | 21 564,5 | 10 902,2 | 3,78 | 1,90 | 260 Medium |
| GAZPROM MEZHREGIONGAZ LLC INN 5003021311 Wholesale of solid, liquid and gaseous fuels |
853 476,4 | 884 803,2 | -29 787,8 | -31 359,5 | -3,51 | -3,61 | 215 Strong |
| Total by TOP-10 companies | 3 094 747,4 | 3 425 180,7 | 27 678,4 | 152 047,4 | |||
| Average value by TOP-10 companies | 309 474,7 | 342 518,1 | 2 767,8 | 15 204,7 | 5,50 | 6,58 | |
| Average value by TOP-1000 companies | 4 583,2 | 4 904,7 | 12,3 | 347,0 | 6,51 | 6,57 | |
The average value of the return on assets ratio of TOP-10 companies is above the average value of TOP-1000 enterprises. Seven from TOP-10 companies increased revenue and net profit indicators in 2016 in comparison with the year 2015. The enterprises, which decreased revenue, profit and return on assets indicators in comparison with the previous periods are marked with red filling in from 2nd up to 7th columns in Table 1.
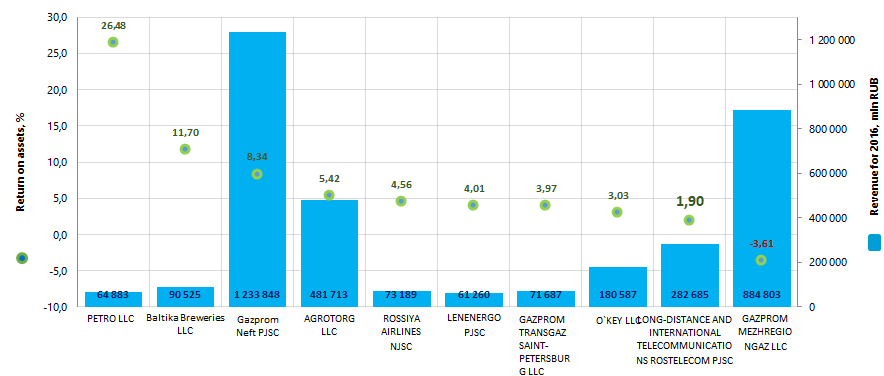 Picture 1. Return on assets ratio and revenue of the largest enterprises of the real economy sector of St. Petersburg (TOP-10)
The industry average values of the return on assets ratio tended to increase over the past three years (Picture 2).
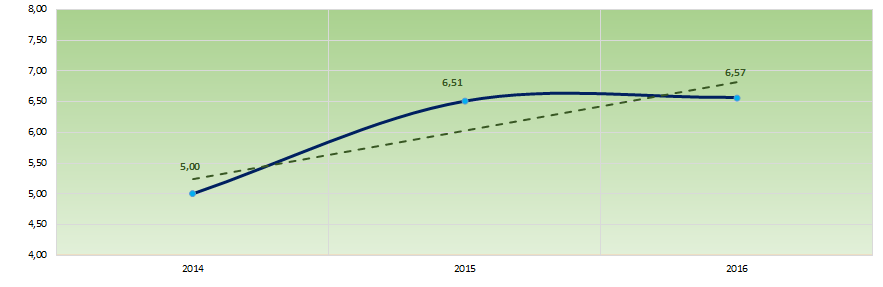 Picture 2. Change in the average industry values of the return on assets ratio of the largest enterprises of the real economy sector of St. Petersburg in 2014 – 2016
All TOP-10 companies got High or Strong/Medium solvency index Globas, that testifies to their ability to repay their debt obligations timely and fully.