
Order a report
Custom-made industry research, company ratings, competitor analysis


Return on sales of textile enterprises
Information agency Credinform offers to get acquainted with the ranking of Russian textile enterprises. The companies with the highest volume of revenue involved in this activity were selected by the experts according to the data from the Statistical Register for the latest available period (for the year 2012). Then, the first 10 enterprises selected by turnover were ranked by decrease in return on sales ratio.
Return on sales ratio (the relation of operating income (before-tax income) to turnover) is an indicator of the pricing policy of a company and presents its ability to monitor its costs. Negative value of the ratio testifies that expenses of an enterprise exceed revenues from sales of products, what is an unfavorable trend.
Recommended or specified values are not determined for the mentioned ratio, because the indicator varies strongly depending on the branch, where each concrete enterprise conducts business. The company should be assessed relying on industry-average indicators.
| № | Name, INN | Region | Turnover for 2012, in mln RUB | Return on sales, % | Solvency index GLOBAS-i® |
|---|---|---|---|---|---|
| 1 | PRYADILNO-NITOCHNY KOMBINAT IM. S.M. KIROVA OJSC INN 7825666563 |
Saint-Petersburg | 1166 | 14,32 | 206 (high) |
| 2 | TDL TEKSTIL LLC INN 3730010504 |
Ivanovo region | 4786 | 11,17 | 196 (the highest) |
| 3 | Neotek OJSC INN 7736600070 |
Moscow | 1892 | 9,21 | 287 (high) |
| 4 | KHLOPCHATOBUMAZHNY KOMBINAT SHUISKIE SITTSY OJSC INN 3706008060 |
Ivanovo region | 2352 | 6,17 | 288 (high) |
| 5 | TORGOVY DOM DARGEZ LLC INN 7706406478 |
Moscow | 1381 | 6,16 | 215 (high) |
| 6 | CHAIKOVSKAYA TEKSTILNAYA KOMPANIYA LLC INN 5920015180 |
Perm territory | 2357 | 4,87 | 225 (high) |
| 7 | Neftekamskoe proizvodstvennoe ob’edinenie iskusstvennyh kozh OJSC INN 264005146 |
Republic of Bashkortostan | 1488 | 2,35 | 226 (high) |
| 8 | Troitskaya kamvolnaya fabrika OJSC INN 5046005770 |
Moscow | 1348 | 1,84 | 234 (high) |
| 9 | Kotovskii zavod netkanyh materialov CJSC INN 6820028830 |
Tambov region | 1421 | 0,7 | 229 (high) |
| 10 | REGENT NETKANYE MATERIALY CJSC INN 7722508646 |
Moscow | 1157 | -9,84 | 335 (satisfactory) |
Basing on obtained results among ten the largest enterprises, it can be drawn a conclusion about high enough profitability of textile manufacture in Russia. Thuswise eight companies from TOP-10 list have the value of the return on sales ratio being above 1.
Return on sales of textile enterprises in Russia, TOP-10
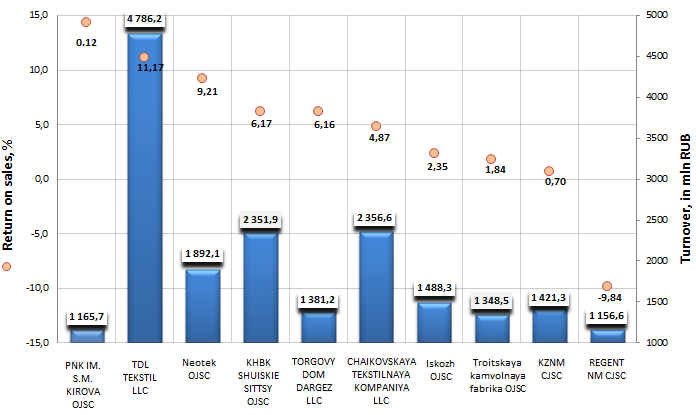
The lead in the ranking was taken by PRYADILNO-NITOCHNY KOMBINAT IM. S.M. KIROVA OJSC (14,32%) and TDL TEKSTIL LLC (11,17%). Both enterprises showed the value of the return on sales above 10%, consequently, more than 10% of revenue is accounted for by profit on sales of these organizations, what can be considered as a good result. The company TDL TEKSTIL LLC is also the largest one on turnover in the branch following the results of the year 2012.
REGENT NETKANYE MATERIALY CJSC is the only one from TOP-10 the largest companies, which showed a negative value of the return on sales, what testifies to surplus costs. According to the combination of financial and non-financial indicators, the enterprise got a satisfactory solvency index GLOBAS-i®, what points to that it cannot pay off its loan liabilities in time and fully.
Now therefore, for the retention of market stability and the assurance of opportunities for further development the enterprises should pay more attention to the return on sales, as well as manage their liability structure more efficiently.
See also: Return on sales of travel agencies
The increase of actual wages outgrows the inflation in the majority of Russian regions
The average nominal accrued wage in Russian Federation amounts 31 537 RUR per one employee for the first half of 2014. It increased on 9,4% in comparison with the corresponding period of 2013. Quite significant growth was neutralized by inflation developments in the economy, which gathered pace under influence of complex geopolitical environment in Ukraine and sanctions policy. As a result, the real surplus of wages occurred to be much lower – just 1,9%.
Customarily, the highest wage was registered in the regions situated in the Russia’s Far North, regions rich in natural resources and in capitals. Most of all in Russia is earned by the residents of Yamalo-Nenets Autonomous Area – RUR 76 484 per month. In the regional rating Moscow is in the 4th place (RUR 58 896 per month), Saint Petersburg – in the 13th place (RUR 38 937 per month). Despite the best wages growth rates in Saint Petersburg, the capital of the North turned out to be in the same place as Moscow (adjusted for inflation), where the actual wage increased on 1% in the annual quantities.
However, there are regions where inflation outgrew the increase of wages. Among these regions are: Pskov region (the actual wage decreased on -3,3%), Vologda region (-2,3%), Kemerovo region (-1,7%), Magadan region (-1,1%) and Kaluga region (0,2%).
The maximum of the wages increase was in the region with the lowest labor expense – Republic of Dagestan (+10,3%). This fact is explained by minimal inflation indicator.
In relation to the new regions of Russian Republic of Crimea (RUR 11 203 per month) and Sevastopol (RUR 11 670 per month), it is difficult at the moment to speak about influence of inflation. The conversion period will for some time exert its own influence. However, according to country’s top leadership, the significant increase of wages to average Russian rate is expected in the short time.
| Rank | Region | Average monthly nominal accrued wage as of I half of 2014, RUR | Surplus by I half of 2013, % | Real surplus (inflation-adjusted) by I half of 2013, % |
|---|---|---|---|---|
| Russian Federation | 31 537 | 9,4 | 1,9 | |
| 1 | Yamalo-Nenets Autonomous Area | 76 484 | 7,9 | 0,1 |
| 2 | Chukotka Autonomous Area | 75 215 | 10,8 | 7,5 |
| 3 | Nenets Autonomous Area | 65 415 | 7,0 | 0,5 |
| 4 | Moscow | 58 896 | 8,6 | 1,0 |
| 5 | Magadan region | 58 503 | 5,9 | -1,0 |
| 6 | Khanty-Mansiisk Autonomous Area - Yugra | 56 908 | 8,5 | 3,5 |
| 7 | Tyumen region | 54 258 | 8,7 | 2,7 |
| 8 | Sakhalin region | 53 116 | 14,2 | 7,8 |
| 9 | Kamchatka Krai | 52 041 | 9,7 | 2,6 |
| 10 | Republic of Sakha Yakutia | 49 188 | 13,3 | 7,6 |
| 11 | Murmansk region | 42 617 | 9,8 | 1,8 |
| 12 | Republic of Komi | 39 479 | 9,0 | 0,8 |
| 13 | Saint Petersburg | 38 937 | 9,4 | 1,0 |
| 14 | Moscow region | 37 627 | 10,0 | 2,0 |
| 15 | Arkhangelsk region | 35 051 | 13,0 | 4,6 |
| 16 | Khabarovsk Krai | 34 844 | 8,6 | 1,6 |
| 17 | Krasnoyarsk Krai | 33 478 | 10,8 | 4,6 |
| 18 | Primorsky Krai | 31 695 | 11,5 | 4,9 |
| 19 | Amur region | 31 447 | 9,2 | 1,2 |
| 20 | Tomsk region | 31 415 | 8,5 | 0,8 |
| 21 | Leningrad region | 31 246 | 9,2 | 1,2 |
| 22 | Irkutsk region | 30 740 | 9,9 | 4,3 |
| 23 | Sverdlovsk region | 29 079 | 8,7 | 0,7 |
| 24 | Republic of Karelia | 29 046 | 8,5 | 1,9 |
| 25 | Jewish Autonomous Region | 28 603 | 9,5 | 2,1 |
| 26 | Zabaykalsky Krai | 28 285 | 9,9 | 3,0 |
| 27 | Republic of Khakasia | 28 224 | 9,0 | 1,3 |
| 28 | Republic of Tyva | 27 329 | 13,6 | 8,9 |
| 29 | Republic of Tatarstan | 27 223 | 10,5 | 3,0 |
| 30 | Republic of Buryatia | 27 104 | 8,8 | 0,1 |
| 31 | Chelyabinsk region | 27 043 | 10,7 | 3,0 |
| 32 | Kaluga region | 26 963 | 9,0 | -0,2 |
| 33 | Perm Krai | 26 251 | 12,3 | 5,3 |
| 34 | Novosibisrk region | 26 244 | 8,4 | 2,0 |
| 35 | Kemerovo region | 26 143 | 6,2 | -1,7 |
| 36 | Vologda region | 26 041 | 6,2 | -2,3 |
| 37 | Kalinigrad region | 26 009 | 9,5 | 1,1 |
| 38 | Omsk region | 25 585 | 7,9 | 0,3 |
| 39 | Kransodar Krai | 25 481 | 11,3 | 2,1 |
| 40 | Nizhny Novgorod region | 25 003 | 11,1 | 2,8 |
| 41 | Samra region | 24 934 | 12,0 | 4,5 |
| 42 | Tula region | 24 635 | 13,1 | 5,9 |
| 43 | Yaroslavl region | 24 283 | 11,3 | 3,0 |
| 44 | Novgorod region | 24 246 | 10,2 | 2,4 |
| 45 | Tver region | 23 861 | 10,0 | 1,3 |
| 46 | Astrakhan region | 23 537 | 10,7 | 4,1 |
| 47 | Republic of Bashkortastan | 23 479 | 8,2 | 1,6 |
| 48 | Ryazan region | 23 037 | 9,8 | 0,6 |
| 49 | Voronezh region | 22 968 | 9,8 | 0,7 |
| 50 | Orenburg region | 22 939 | 11,3 | 4,5 |
| 51 | Belgorod region | 22 932 | 8,4 | 2,2 |
| 52 | Volgograd region | 22 909 | 14,6 | 7,2 |
| 53 | Udmurt Republic | 22 827 | 12,0 | 4,5 |
| 54 | Rostov region | 22 561 | 9,9 | 2,5 |
| 55 | Lipetsk region | 22 275 | 9,0 | 1,6 |
| 56 | Kursk region | 22 122 | 12,2 | 4,6 |
| 57 | Republic of Altai | 22 036 | 10,2 | 2,5 |
| 58 | Chechen Republic | 21 914 | 5,6 | 1,2 |
| 59 | Vladimir region | 21 889 | 13,3 | 3,9 |
| 60 | Smolensk region | 21 581 | 12,6 | 3,0 |
| 61 | Penza region | 21 417 | 10,3 | 2,6 |
| 62 | Stavropolsky Krai | 21 370 | 10,2 | 3,5 |
| 63 | Republic of Ingushetia | 21 321 | 3,8 | 0,6 |
| 64 | Saratov region | 21 284 | 8,2 | 1,3 |
| 65 | Pskov region | 20 367 | 5,5 | -3,3 |
| 66 | Ulyanovsk region | 20 358 | 12,4 | 4,2 |
| 67 | Kurgan region | 20 322 | 9,2 | 1,4 |
| 68 | Kostroma region | 20 272 | 10,6 | 3,9 |
| 69 | Kirov region | 20 253 | 11,1 | 3,4 |
| 70 | Chuvash Republic | 20 249 | 9,2 | 2,2 |
| 71 | Bryansk region | 20 239 | 10,8 | 1,2 |
| 72 | Republic of Adygeya | 20 179 | 9,2 | 1,9 |
| 73 | Orel region | 20 063 | 10,3 | 1,5 |
| 74 | Republic North Ossetis-Alania | 19 922 | 10,2 | 3,8 |
| 75 | Ivanovo region | 19 789 | 9,6 | 0,0 |
| 76 | Tambov region | 19 668 | 9,9 | 1,9 |
| 77 | Republic of Mari El | 19 604 | 11,3 | 3,8 |
| 78 | Republic of Kalmykia | 19 030 | 14,0 | 8,7 |
| 79 | Kabardino-Balkar Republic | 19 022 | 9,3 | 2,8 |
| 80 | Karachai-Cherkess Republic | 18 940 | 11,5 | 5,0 |
| 81 | Altaisky Krai | 18 734 | 9,4 | 1,2 |
| 82 | Republic of Mordovia | 18 692 | 10,6 | 2,7 |
| 83 | Republic of Dagestan | 18 604 | 13,8 | 10,3 |
| 84 | Sevastopol (according to the State statistics service of Ukraine, Rosstat in conversion to exchange rate of the Central Bank of Russia) | 11 670 | 2,6 | н.д. |
| 85 | Republic of Crimea (according to the State statistics service of Ukraine, Rosstat in conversion to exchange rate of the Central Bank of Russia) | 11 203 | 5,0 | н.д. |
See also: Where is it convenient to live in Russia?