Herald
Rating of socio-economic development of the regions

In the April Credinform Newsletter the rating of the Russian regions by socio-economic development is presented.

Development disparity of the Russian regions is long-standing and remains to be one of the key problems for the government and population. Increase in diversity among regions results in disturbance of social equilibrium of the country in general, as well as in differentiation of subject on leaders (minority) with large migration flows directed in, and territories in state of permanent crisis.

First of all, dissimilarity of figures is caused by availability or lack of mineral resources, development of industry and service sector, concentration of economic activity human and financial flows as a result, and climate conditions at a low-grade. As a rule, economic well-being of a region is a key to its good social development level, but there are exemptions: for example, the Republic of Ingushetia is behind by almost all economic indicators, but leads by the average expected lifespan. At the same time, Chukotka autonomous district with very high fiscal revenues, gross regional product and wage level has very low life span (second to last countrywide). In Yamal-Nenets autonomous district, similar to Chukotka by severe climate and economic situation, the life span is considerably higher and increase in population takes place there.

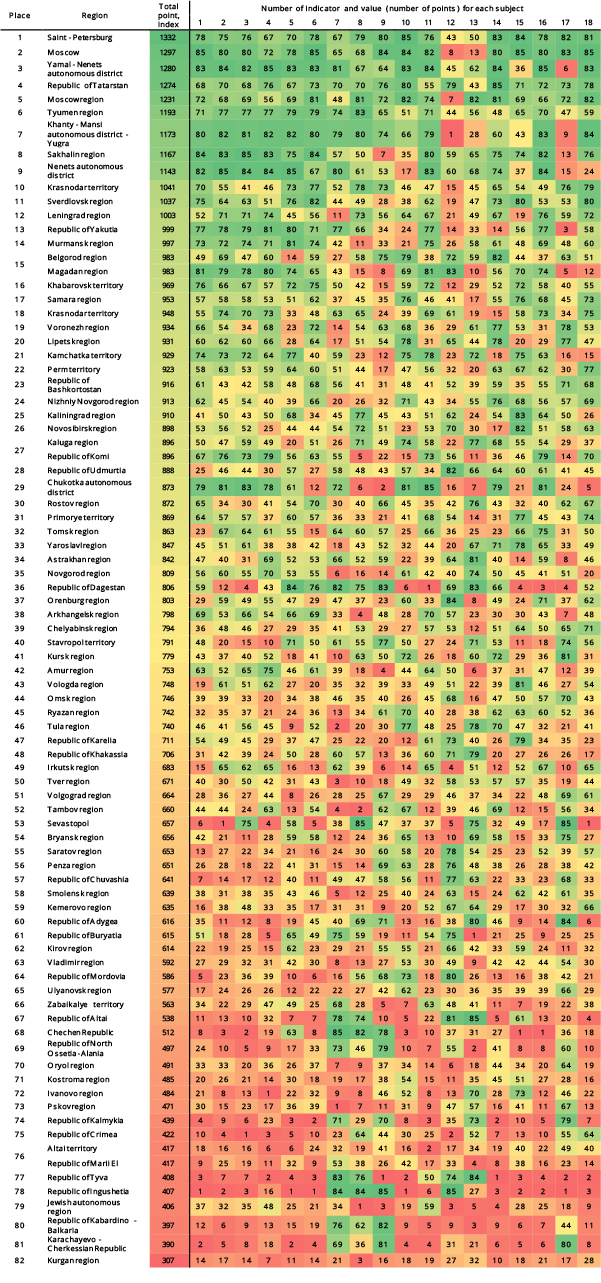
18 figures, the full list of which is presented in Table 1, were used to make a rating. The region can get from 1 to 85 points for each indicator: 85 points go for the best value and 1 for the worst. In summary, the maximum total point (index) is 1530 and the minimal is 18.

The set of indicators shows the development of economic and social potential of every region of the country quite full.

Таблица 1. List of indicators using for the rating of socio-economic development of the regions, for 2015-2016
Indicator
1 Actual final consumption of household per capita by the RF subjects
2 Gross regional product per capita
3 Fiscal revenue of the RF subject net of uncompensated receipts per capita
4 Fixed investment per capita in actual established price
5 Public catering turnover per capita
6 Retail sales per capita
7 Total rate of natural increase per annum
8 Relative population increase per annum
9 Life expectancy at birth, both sexes, population at large
10 Unemployment level, yearly average
11 Average nominal wage paid
12 Consumer price index - inflation
13 Industrial production index
14 Population with cash income lower than level of the cost of living, as percentage of total population
15 Number of legal entities per 1000 people of population
16 Return of taxes and duties to the budget system of the RF by major economic sectors, RUB per 1 resident
17 Share of old and condemned buildings in the total volume of the housing stock of the RF subject
18 Fixed assets value at the year-end, by gross book value

Top three in the rating (see Table 2) consists of Saint-Petersburg with 1332, Moscow (1297) and the Yamal-Nenets autonomous district (1280). Moscow failed to have a lead because of higher annual inflation and lower point for industrial production dynamics. Speaking about relative figures, the capital had decrease in production sector by 3,5% in the past year, and Saint-Petersburg demonstrated increase by 3,9%. However, Moscow got maximum values by the following indicators: actual final consumption of household per capita, number of legal entities per 1000 people of population and fixed assets value. As of St. Petersburg, the level of yearly unemployment is the lowest countrywide, that is why the city got 85 of 85 points. The Yamal-Nenets autonomous district got the highest point for fixed investment per capita and return on taxes and duties to the budget system of the RF per 1 resident.

Sevastopol is the 53rd due to the best indicator of relative population increase (by means of migration) and low percent of condemned buildings. However, the region is at the end by gross regional product per 1 resident and fixed assets value. The Republic of Crimea is the 75th due to poor data on budget income (net of subsidies of the federal center) and fixed investment per capita, as well as high inflation level.

Kurgan region with total index of 307 closes the rating being behind Saint-Petersburg in 4,3 times. The region got high values by none of 18 indicators. Situation both in economic and social sphere is rather bad.

At such a strong level of regional varieties, the state continues to pursue a policy of fiscal equalization redistributing income from “rich” to “poor” that is reasonable under fiscal centralization.

Fundamental changes in the rating should not be expected in a short-term: metropolitan agglomeration and a small group of donor regions concentrating the main resource and industrial potential of the country will keep the leadership in the top ten. In 2017 Moscow stands a good chance to get a leadership in case of local production industry will approach a positive trend.

Speaking about other RF subjects, only the Republic of Crimea is able for significant stabilization due to the range of investment and social programs implemented by the government.

Table 2. Rating of socio-economic development of the regions (Dark green shading – maximum point, dark red shading – minimal point)

Table 2. Rating of socio-economic development of the regions
Ranking
The largest Russian tool manufacturers on the return on equity ratio

Information agency Credinform Credinform пoffers the ranking of the largest Russian tool manufacturers. The enterprises with the largest volume of revenue (TOP-10 and TOP-100) were selected for the ranking, according to the data from the Statistical Register for the latest available periods (for 2014 and 2015). Then they were ranked by the return on equity ratio in 2015 (Table 1).

Return on equity (%) is calculated as the relation of company’s net profit to its own capital. The ratio determines the efficiency of use of the capital invested by owners of the enterprise and shows the amount of monetary units of net profit earned by each unit invested by them.

This indicator is used by investors and owners of companies to estimate their investments. The higher is the ratio value, the more profitable are investments. If the return on equity is negative or has zero value, it is necessary to analyze reasonability and effectiveness of investments in the enterprise in the future. In such cases the value of the coefficient should be compared with the investment of funds in shares of other companies, bonds or in a bank.

Too high ratio value, in its turn, may have a negative impact on company’s financial stability: more profitability - more risks.

The experts of the Information agency Credinform Credinform, taking into account the actual situation as well in the economy in general as in sectors, have developed and implemented in the Information and Analytical system Globas-i® the calculation of practical values of financial coefficients, which can be recognized as normal for a particular industry. For tool manufacturers the practical value of the solvency ratio is from 7,32%.

For getting of the most comprehensive and fair picture of the financial standing of an enterprise it is necessary to pay attention to all combination of company’s financial indicators and ratios.

Table 1. Net profit, revenue, return on equity, solvency index Globas-i® of the largest Russian tool manufacturers (TOP-10)
Name, INN, region Net profit (loss) for 2015, mln RUB Revenue for 2015, mln RUB Revenue for 2015 by 2014, % Return on equity, % Solvency index Globas-i®
URALBURMASH PAOИНН 6646000133 Sverdlovsk region -424,7 633,9 13,5 181,09 307 Satisfactory
INSTRUMENT-SERVIS LLC ИНН 5754006620 Orel region 33,1 491,1 31,2 24,05 247 High
ZUBR OVK JSC ИНН 5029036344 Moscow region 29,4 647,0 -32,7 22,33 223 High
BOSCH POWER TOOLS LLC ИНН 6449043071 Saratov region 275,6 3 686,6 42,1 21,65 226 High
JSC SANDVIK-MKTC ИНН 7715082847 Moscow 170,6 920,6 16,6 17,99 169 The highest
JSC ZBO DRILL INDUSTRIES ИНН 5612002652 Orenburg region 23,7 488,4 57,1 16,72 267 High
SATURN - INSTRUMENTALNY ZAVOD NAO ИНН 7610090537 Yaroslavl region 42,6 885,6 37,0 7,34 255 High
SEROVSKII MEKHANICHESKII ZAVOD PAO ИНН 6680000479 Sverdlovsk region 38,4 1 045,1 9,5 2,61 167 The highest
IZHSTAL-TNP LLC ИНН 1832035310 Udmurt Republic -5,7 608,2 7,6 -11,12 290 High
INSTRUMENTALNYI ZAVOD - PERMSKIE MOTORY NAO ИНН 5904103714 Perm territory -11,9 886,6 12,5 -34,52 300 Satisfactory
Total in the group of TOP-10 companies 171,2 10 293,0      
Total in the group of TOP-100 companies 818,6 23 981,0      
Average value in the group of TOP-10 companies 17,1 1 029,3 20,5 24,81  
Average value in the group of TOP-100 companies 8,2 239,8 18,8 2,11  
Industry average value 1,3 56,6 -1,0 7,32  

The average value of the return on equity in 2015 in the group of TOP-10 companies and industry average index are higher than practical value, and in the group of TOP-100 enterprises - lower ( are marked with green and red fillings, respectively, in Table 1 and Picture 1). By this, IZHSTAL-TNP LLC and INSTRUMENTALNYI ZAVOD - PERMSKIE MOTORY NAO have negative return on equity ratios.

Picture 1. Return on equity ratio and revenue of the largest Russian tool manufacturers (TOP-10) Picture 1. Return on equity ratio and revenue of the largest Russian tool manufacturers (TOP-10)

The volume of revenue of 10 the largest companies made 43% of the total revenue of 100 the largest enterprises in 2015. It points to a relatively high level of competition in the industry. Thus, the volume of revenue of the largest company in the industry, BOSCH POWER TOOLS LLC , made 15% of the total revenue of 100 the largest enterprises, while the rest of companies are several times behind the leader (Picture 2).

Picture 2. Shares of TOP-10 enterprises in the total revenue of the group of TOP-100 companies for 2015, % Picture 2. Shares of TOP-10 enterprises in the total revenue of the group of TOP-100 companies for 2015, %

Eight from TOP-10 companies got high solvency index Globas-i®, that points to their ability to repay their debts in time and fully.

URALBURMASH PAO and INSTRUMENTALNYI ZAVOD - PERMSKIE MOTORY NAO got satisfactory solvency indexes Globas-i®, due to the information on their participation as a defendants in arbitration court proceedings in terms of debt collection, cases of untimely fulfillment of obligations, as well as the loss in the structure of balance sheet indicators. The forecast for index development of these companies is stable.

Nine from TOP-10 enterprises increased the indicators of revenue in 2015 compared to the previous period. Four companies reduced the amount of revenue or there is a loss (are marked with red filling in Table 1)

In the group of TOP-100 companies there were 18 loss-making companies in 2014, in 2015 their number decreased to 14. By this, their average loss increased by more than 60% (Picture 3).

Picture 3. The amount of loss-making companies and their average loss (mln RUB) in the group of TOP-100 enterprises in 2014 – 2015 Picture 3. The amount of loss-making companies and their average loss (mln RUB) in the group of TOP-100 enterprises in 2014 – 2015

In general, industry ratios of the return on equity fit into the parameters of practical value in 2006 - 2013 and in 2015 (Picture 4), that testifies to a relatively high level of investment returns.

Picture 4. Industry average values of the return on equity ratio of Russian tool manufacturers in 2006 – 2015 Picture 4. Industry average values of the return on equity ratio of Russian tool manufacturers in 2006 – 2015

The industry indicators in terms of money are generally not stable, that is confirmed by the data of the Federal State Statistics Service (Picture 5 and Table 2).

Picture 5. Growth rates (rates of drawdown) of the volume of output of tools in monetary terms, from year to year, % Picture 5. Growth rates (rates of drawdown) of the volume of output of tools in monetary terms, from year to year, %

In the period from 2010 to 2016 the largest volume of tool production was observed in the year 2012. (Table 2).

Table 2. Volume of output of tools in monetary terms, mln RUB
2007  2008  2009  2010  2011  2012  2013  2014  2015  2016 
783,5 986,1 851,7 929,8 1 020,8 1 230,6 1 149,7 950,4 1 107,3 1 068,4

*) In Table 2 the red filling marks the decline in the volume of output, green filling – the growth.

The enterprises for tools’ manufacture are distributed unevenly throughout the country. Their greatest concentration is observed in regions, which have the infrastructure and qualified workforce, being relevant for high-tech production. This is confirmed by data of the Information and Analytical system Globas-i®, according to which 100 the largest companies in terms of revenue for 2015 are registered in 34 regions of Russia (Picture 6).

Picture 6. Distribution of 100 the largest tool manufacturers by regions of Russia Picture 6. Distribution of 100 the largest tool manufacturers by regions of Russia