
Order a report
Custom-made industry research, company ratings, competitor analysis


Activity trends in shipbuilding
Information agency Credinform presents an overview of trends in shipbuilding industry.
The largest companies in the industry (TOP-100) in terms of annual revenue for the last reporting periods available to the state statistics bodies and the Federal Tax Service (2016-2020) were selected for the analysis. Selection and analysis of companies were carried out based on data from the Information and Analytical system Globas.
Net assets – is a ratio that reflects the real value of company's property that is calculated annually as difference between assets on company's balance sheet and its debt obligations. The net asset ratio is negative (insufficient property) when company's debt exceeds value of its property.
The largest company in the industry in terms of net assets is UNITED SHIPBUILDING CORPORATION JSC, INN 7838395215, Saint Petersburg. In 2020 net assets amounted to more than 301 billion rubles.
The smallest amount of net assets in the TOP-100 was owned by BALTIC SHIPYARD JSC, INN 7830001910, Saint Petersburg. Insufficiency of property in 2020 was expressed by a negative value of -9.7 billion rubles.
During the five-year period, average net assets of the TOP-100 tend to increase with positive growth rates (Picture 1).
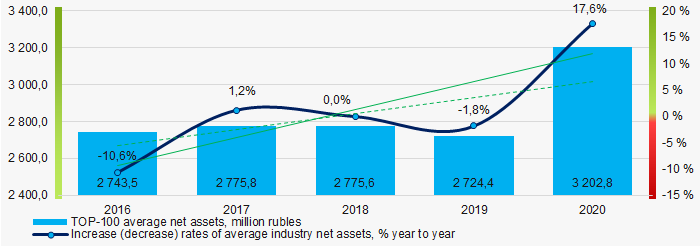 Picture 1. Changes in average net assets of TOP-100 companies in 2016-2019.
Shares of companies with property insufficiency in the TOP-100 had a positive downward trend during the five years period (Picture 2).
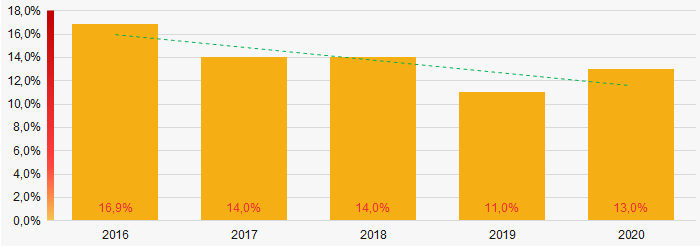 Picture 2. Shares of companies with negative net assets in the TOP-100 in 2016-2019
Sales revenue
Revenue of the top three companies in 2020 constituted over 54% of the total revenue of TOP-100 companies. (Picture 3). This indicates a high level of monopolization in the shipbuilding industry.
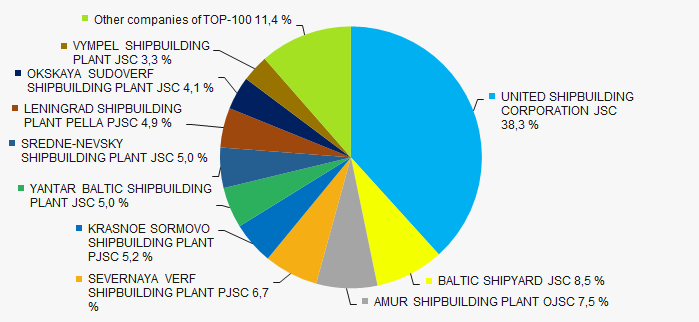 Picture 3. Shares of TOP-10 companies in the total revenue in 2020. TOP-100
In general, there is a tendency of revenue increasing with a positive growth rate. (Picture 4).
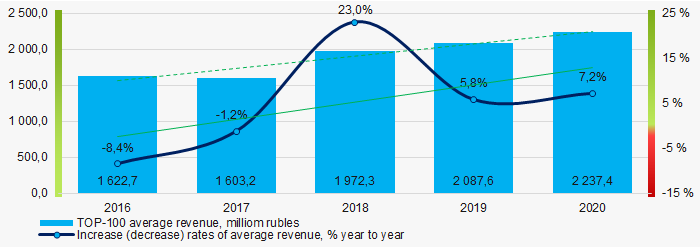 Picture 4. Changes in average revenue values of TOP-100 companies in 2016-2020
Profit and loss
The largest company in the TOP-100 in terms of net profit in 2020 is also UNITED SHIPBUILDING CORPORATION JSC. The company's profit amounted to 1.5 billion rubles.
During the five-year period, average loss rates of TOP-100 companies tend to increase. (Picturе 5).
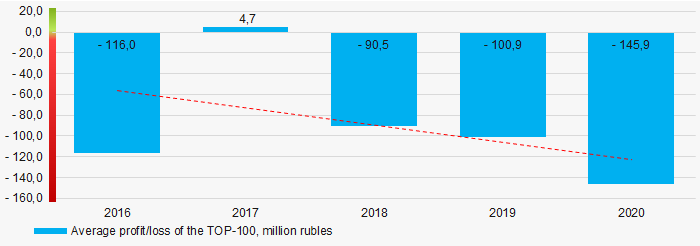 Picture 5.Changes in average profit (loss) indicators of TOP-100 companies in 2016-2020
During the past five years, average values of net profit indicators of TOP-100 companies have not decreased, while average net loss increased (Picture 6).
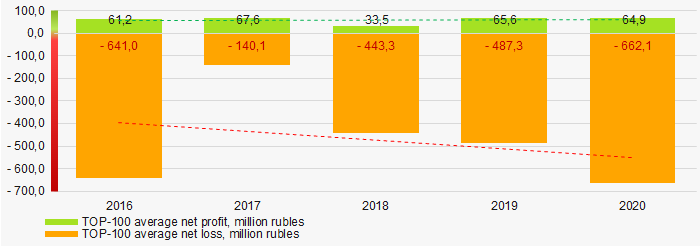 Picture 6. Changes in average values of net profit and net loss indicators of TOP-100 companies in 2016-2020.
Key financial ratios
During the five-year period, average values of the total liquidity ratio of TOP-100 companies were above the range of recommended values - from 1.0 to 2.0 with a downward trend. (Picture 7).
Total liquidity ratio (current assets to short-term liabilities) shows sufficiency of company’s assets to settle short-term liabilities.
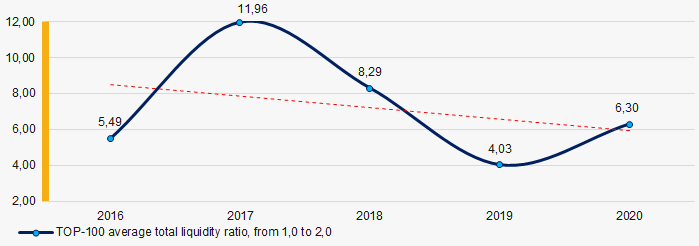 Picture 7. Changes in average values of total liquidity ratio of TOP-100 companies in 2016-2020.
During the past five years, average return on investments ratio of TOP 100 companies has shown an upward trend (Picture 8).
This ratio is calculated as ratio of net profit to amount of equity and long-term liabilities and demonstrates return on equity involved in commercial activities and the long-term funds raised by organization.
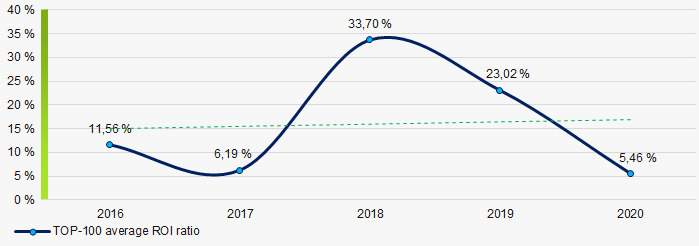 Picture 8. Changes in average values of the ROI ratio of TOP-100 companies in 2016-2020.
Asset turnover ratio is calculated as ratio of sales revenue to average value of total assets for a period and implicates the efficiency of use of all available resources; regardless of sources, they were raised. The ratio shows how many times per year the full cycle of production and turnover is performed generating the corresponding effect in the form of profit.
During the five-year period values of the said business activity ratio showed a trend to decrease (Picture 9).
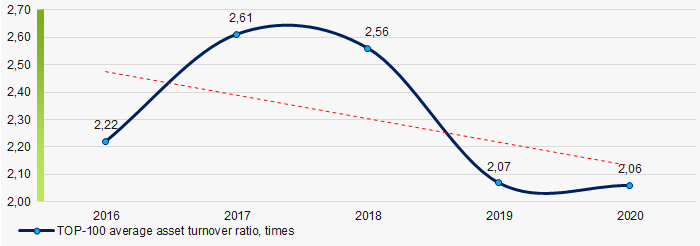 Picture 9. Changes in average values of the asset turnover ratio of TOP-100 companies in 2016-2020
Small enterprises
75% of TOP-1000 companies are registered in the Unified Register of Small and Medium-sized Enterprises of the Russian Federation Federal Tax Service. At the same time, their share in the total revenue of the TOP-1000 in 2020 is only 2%, which is significantly lower than the national average in 2018-2019. (Picture 10).
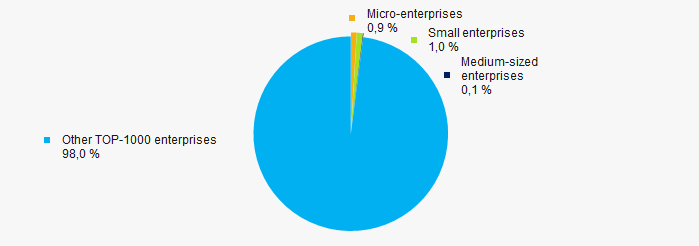 Picture 10. Revenue share of small and medium-sized enterprises in the TOP-100
Main regions of activity
The TOP-100 companies are registered in 30 regions and are distributed unevenly across the country due to the geographical specifics of shipbuilding industry. Almost 62% of the total revenue of TOP-100 companies in 2020 is concentrated in St. Petersburg (Picture 11).
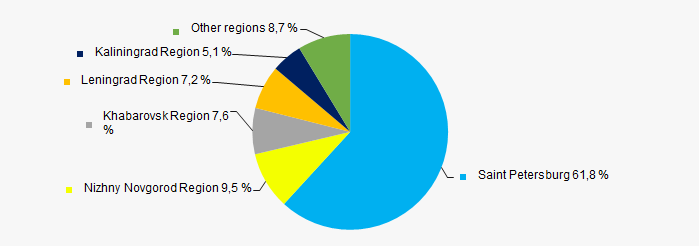 Picture 11. Distribution of TOP-100 companies' revenue by regions of Russia
Financial position score
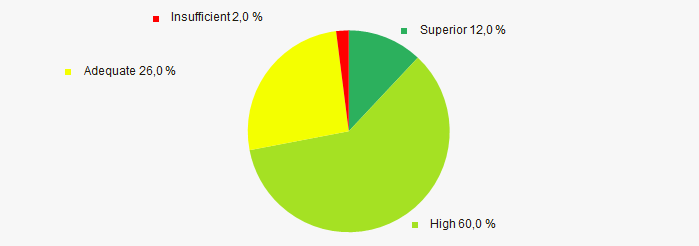
The assessment of the financial position of TOP-100 companies shows that the largest part of them is in a financial position above average. (Picture 12).
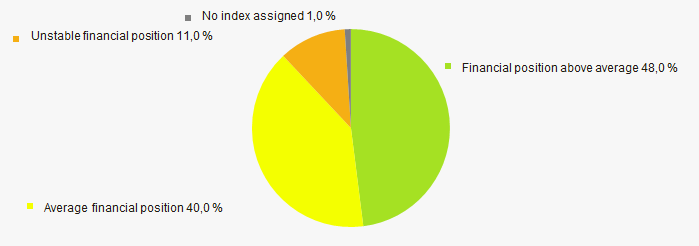 Picture 12. Distribution of TOP-100 companies by financial position score
Globas Solvency Index
The vast majority of TOP-100 companies are assigned superior and high Globas Solvency Index, which indicates their ability to repay their debt obligations on time and fully (Picture 13).
 Picture 13. Distribution of TOP-100 companies according to the Globas Solvency Index
Conclusion
Comprehensive assessment of activities of the largest shipbuilding enterprises, that takes into account main indexes, financial indicators and coefficients, indicates predominance of positive trends in their activities in the period from 2016 to 2020. (Table 1).
| Trends and evaluation factors | Share of factor, % |
| Dynamics of average net assets value | |
| Growth (decline) rate in average size of net assets | |
| Increase / decrease in share of enterprises with negative values of net assets | |
| Level of equity concentration | |
| Dynamics of average revenue | |
| Growth (decline) rate in average size of revenue | |
| Dynamics of average profit (loss) | |
| Growth / decline in average values of companies’ net profit | |
| Increase / decline in average values of companies' net loss | |
| Increase / decrease in average values of overall liquidity ratio | |
| Increase / decrease in average values of return on investment ratio | |
| Increase / decrease in average values of asset turnover ratio, times | |
| The share of small and medium-sized enterprises in revenue is more than 20% | |
| Regional concentration | |
| Financial position (the largest share) | |
| Globas Solvency Index (the largest share) | |
| Average value of factors share | |
![]() positive trend (factor),
positive trend (factor), ![]() negative trend (factor)
negative trend (factor)