
Order a report
Custom-made industry research, company ratings, competitor analysis


Trends in waste disposal
Information agency Credinform has observed trends in the activity of the largest Russian enterprises engaged in collection, processing and disposal of waste. Companies with the largest volume of annual revenue (TOP-10 and TOP-1000), were selected for the analysis, according to the data from the Statistical Register for the latest available periods (for 2015-2017). The analysis was made on the basis of the data of the Information and Analytical system Globas.
Net assets - indicator, reflecting the real value of company's property, is calculated annually as the difference between assets on the enterprise balance and its debt obligations. The indicator of net assets is considered negative (insufficiency of property), if company’s debt exceeds the value of its property.
| № in TOP-1000, name, INN, region, main type of activity |
Net assets value, mln RUB | Solvency index Globas | ||
| 2015 | 2016 | 2017 | ||
| 1 | 2 | 3 | 4 | 5 |
| 1 GUP EKOTEKHPROM INN 7706043312 Moscow Waste collection |
6383 | |
|
299 Medium |
| 2 JSC WASTE MANAGEMENT INN 7725727149 Moscow Processing and disposal of non-hazardous waste |
-323 | |
|
269 Medium |
| 3 FEDERAL STATE-OWNED COMPANY GORNIY INN 6418001160 Saratov region Waste collection |
4011 | |
|
290 Medium |
| 4 SPB GUDP CENTR INN 7812021254 Saint-Petersburg Waste collection |
2854 | |
|
217 Strong |
| 5 SUE SIA Radon INN 7704009700 Moscow Waste collection |
3009 | |
|
259 Medium |
| 996 JSC KEK INN 1655041708 The Republic of Tatarstan Waste collection |
20 | |
|
316 Adequate |
| 997 JSC Special Facility for Disposal INN 2320189736 Krasnodar region Waste collection |
-243 | |
|
293 Medium |
| 998 LLC WASTE DISPOSAL - VOLGOGRAD INN 3426013572 Volgograd region Waste collection |
-155 | |
|
322 Adequate |
| 999 LLC EVN-Ekotechprom MSZ 3 INN 7737520364 Moscow Waste collection |
22 | |
|
323 Adequate |
| 1000 JSC Concel INN 7735093237 Moscow Disposal of sorted waste |
-2211 | |
|
276 Medium |
![]() — growth of the indicator to the previous period,
— growth of the indicator to the previous period, ![]() — decline of the indicator to the previous period.
— decline of the indicator to the previous period.
For ten years average amounts of net assets of TOP-1000 companies have increasing tendency (Picture 1).
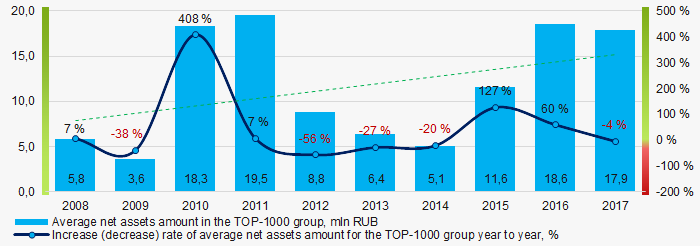 Picture 1. Change in TOP-1000 average indicators of the net assets amount of the enterprises engaged in collection, processing and disposal of waste in 2008 – 2017
Share of companies with insufficiency of property among TOP-1000 for the last three years tends to increase (Picture 2).
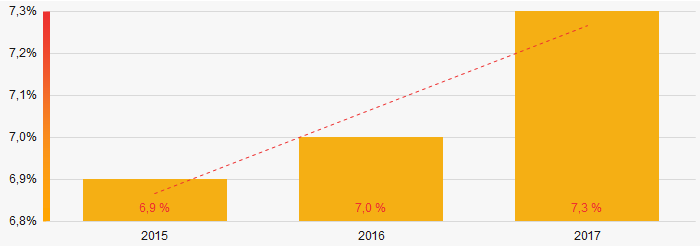 Picture 2. Share of companies with negative value of net assets amount in TOP-1000 in 2015 – 2017
 Sales revenue
The revenue of 10 leaders of the industry made 19% of the total revenue of TOP-1000 companies in 2017(Picture 3). It demonstrates relatively high level of competition.
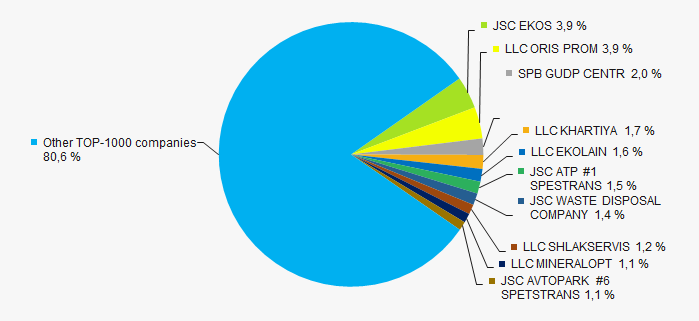 Picture 3. Shares of participation of TOP-10 companies in the total revenue of TOP-1000 companies for 2017
In general, a decrease of indicators of average revenue volume is observed (Picture 4).
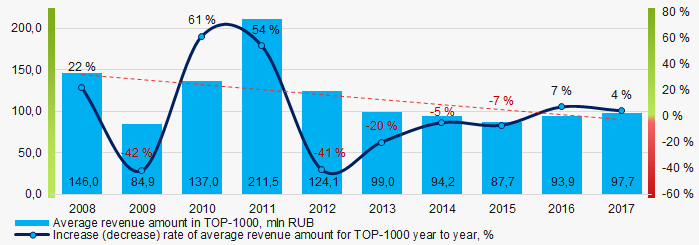 Picture 4. Change in the average revenue of the enterprises engaged in collection, processing and disposal of waste in 2008 – 2017
 Profit and losses
The profit volume of 10 leading enterprises in 2017 made 25% of the total profit of TOP-1000 companies (Picture 5).
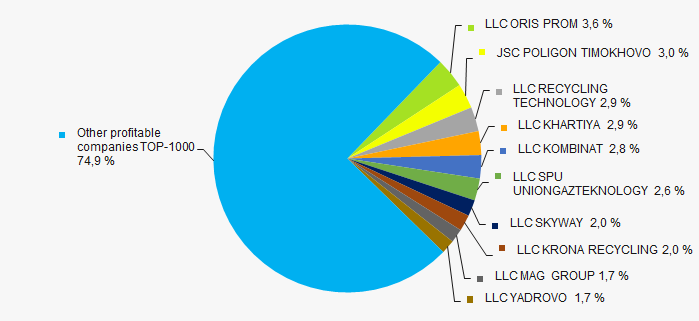 Picture 5. Share of participation of TOP-10 companies in the total volume of profit of TOP-1000 companies for 2017
Over a ten-year period, the average values of profit indicators of TOP-1000 companies tend to increase (Picture 6).
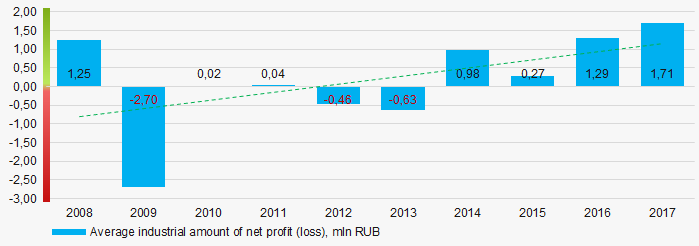 Picture 6. Change in the average indicators of net profit of the enterprises engaged in collection, processing and disposal of waste in 2008 – 2017
 Over the three-year period average values of net profit indicators of TOP-1000 companies have increasing tendency, besides, average amount of net loss is increasing. (Picture 6).
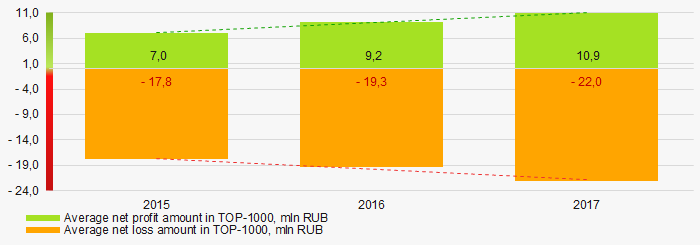 Picture 7. Change in the average indicators of profit and loss of TOP-1000 companies in 2015 – 2017
 Key financial ratios
Over the ten-year period the average indicators of the current liquidity ratio were above the range of recommended values – from 1,0 up to 2,0 with increasing tendency (Picture 8).
The current liquidity ratio (the relation of the amount of current assets to short-term liabilities) shows the sufficiency of company’s funds for repayment of its short-term liabilities.
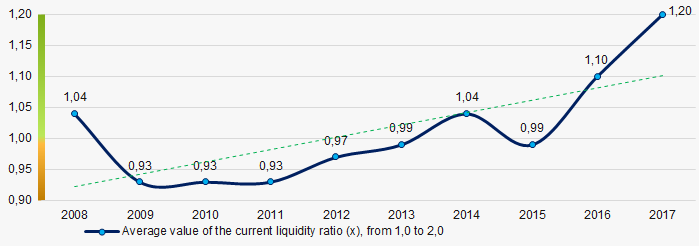 Picture 8. Change in the industry values of the current liquidity ratio of the enterprises engaged in collection, processing and disposal of waste in 2008 – 2017
 Increasing tendency in the indicators of the return on investments ratio has been observed for ten years. (Picture 9)
The ratio is calculated as the relation of net profit to the sum of own capital and long-term liabilities and demonstrates the return on the equity involved in the commercial activity of own capital and the long-term borrowed funds of an organization.
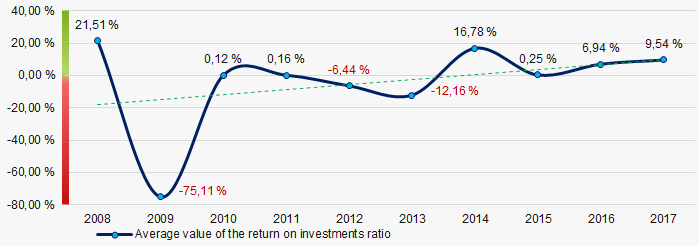 Picture 9. Change in the average values of the return on investments ratio of the enterprises engaged in collection, processing and disposal of waste in 2008 – 2017
Asset turnover ratio is calculated as the relation of sales revenue to the average value of total assets for a period and characterizes the efficiency of use of all available resources, regardless of the sources of their attraction. The ratio shows how many times a year a complete cycle of production and circulation is made, yielding profit.
This business activity ratio showed a tendency to decrease for ten-year period (Picture 10).
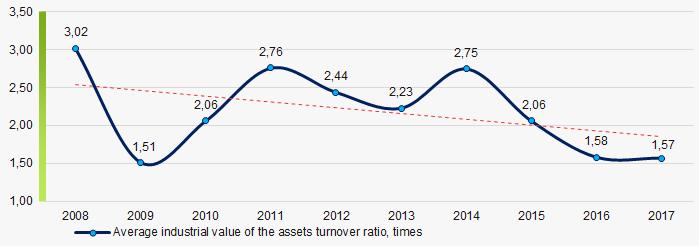 Picture 10. Change in the average values of the asset turnover ratio of the enterprises engaged in collection, processing and disposal of waste in 2008 – 2017
 Production structure
The largest share in the total revenue of TOP-1000 is owned by companies, specializing in waste collection (Picture 11).
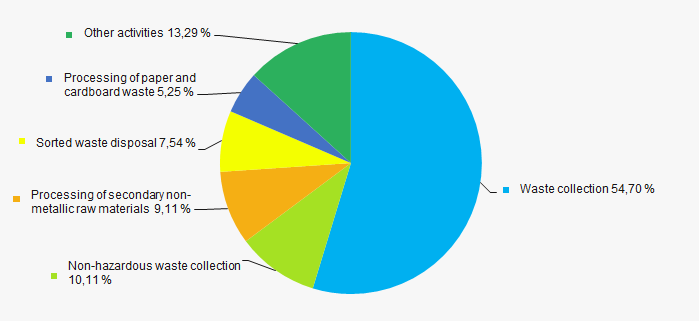 Picture 11. Distribution of companies by types of output in the total revenue of TOP-1000, %
76% of TOP-1000 companies are registered in the Register of small and medium enterprises of the Federal Tax Service of the RF. Besides, share of the companies in the total revenue of TOP-1000 amounts to 61% in 2017, that is almost three times exceeds the average indicator (Picture 12).
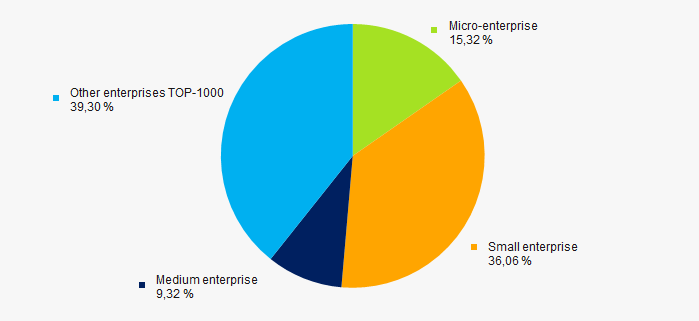 Picture 12. Shares of small and medium enterprises in TOP-1000 companies, %
Main regions of activities
TOP-1000 companies are unequally distributed on the territory of Russia because of peculiarities of the geographic position and registered in 77 regions. The largest companies in terms of revenue volume are concentrated in Moscow and Saint-Petersburg (Picture 13).
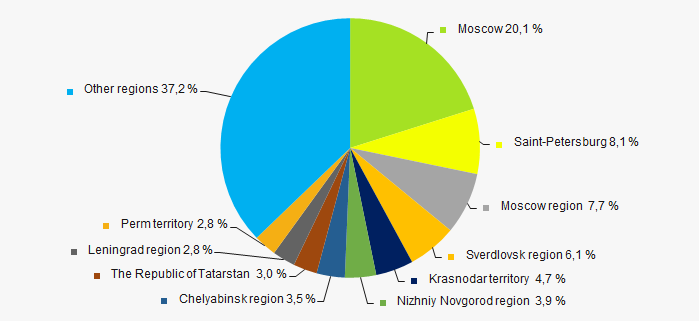 Picture 13. Distribution of revenue of TOP-1000 companies by regions of Russia
 Financial position score
An assessment of the financial position of TOP-1000 companies shows that majority of companies are in an above the average financial position (Picture 14).
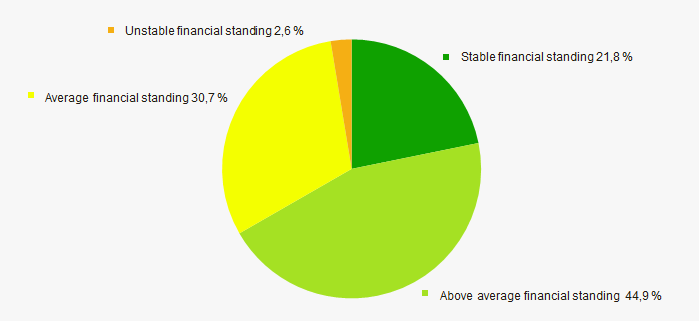 Picture 14. Distribution of TOP-1000 companies by financial position score
Solvency index Globas
Most of TOP-1000 companies have got Medium Solvency index Globas, points to their ability to repay their debts in time and fully (Picture 15).
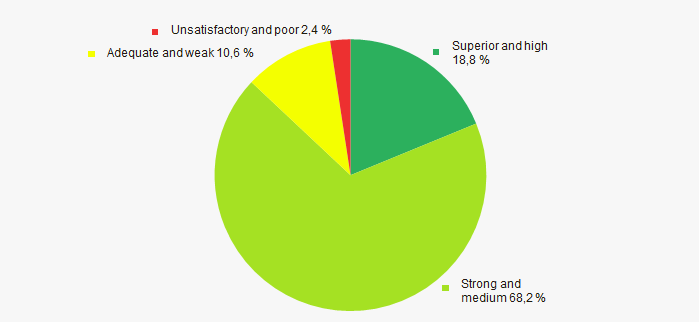 Picture 15. Distribution of TOP-1000 companies by solvency index Globas
Industrial production index
According to the data from the Federal State Statistics Service, during 12 months of 2018 increasing tendency for the industrial production index of the enterprises engaged in collection, processing and disposal of waste is observed (Picture 16).
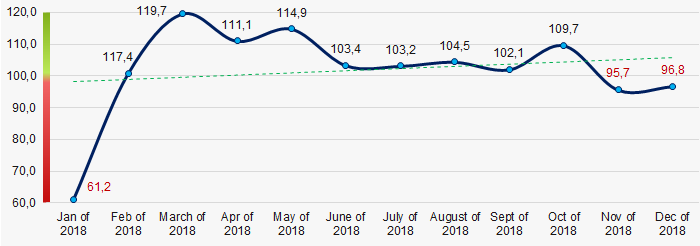 Picture 16. Industrial production index of manufacture of the enterprises engaged in collection, processing and disposal of waste in 2017 – 2018, month to month (%))
Conclusion
Comprehensive assessment of the activity of largest enterprises engaged in collection, processing and disposal of waste, taking into account the main indexes, financial indicators and ratios, demonstrates the presence of favorable trends (Table 2)
| Trends and assessment factors | Share of factor, % |
| Rate of increase (decrease) of average amount of net assets | |
| Increase / decrease of share of companies with negative values of net assets | |
| Increase (decrease) rate of average revenue amount | |
| Rate of competition / monopolization | |
| Increase (decrease) rate of average net profit (loss) amount | |
| Increase / decrease of average net profit amount of TOP-1000 companies | |
| Increase / decrease of average net loss amount of TOP-1000 companies | |
| Increase / decrease of average industrial values of the current liquidity ratio | |
| Increase / decrease of average industrial values of the return on investments ratio | |
| Increase / decrease of average industrial values of the assets turnover ratio, times | |
| Share of small and medium enterprises in the industry in terms of revenue volume more than 22% | |
| Regional concentration | |
| Financial position (major share) | |
| Solvency index Globas (major share) | |
| Industrial production index | |
| Average value of factors | |
![]() — positive trend (factor) ,
— positive trend (factor) , ![]() — negative trend (factor).
— negative trend (factor).