
Order a report
Custom-made industry research, company ratings, competitor analysis


TOP-10 of companies that received support from the government
Information agency Credinform represents a ranking of the largest Russian companies that received support from the government (subsidies, subventions, budget investments, inter-budget transfers, independent guarantees, sureties and training events of the SME Corporation). Companies with the largest volume of annual revenue (TOP-10) were selected for the ranking, according to the data from the Statistical Register and the Federal Tax Service for the latest available periods (2018 - 2019). They were ranked by the liabilities to assets ratio (Table 1). The analysis was based on the data of the Information and Analytical system Globas.
Liabilities to assets ratio shows the share of assets financed by loans. The standard value for this ratio is from 0.2 to 0.5.
Sales revenue and net income show the scale and efficiency of the business activity, and the liabilities to assets ratio indicates the risk of the entity’s insolvency.
Exceeding the upper standard value indicates excessive debt load, which can stimulate development, but negatively affects the stability of the financial position of the company. If the value is below the standard value, this may indicate a conservative strategy of financial management and excessive caution in attracting new borrowed funds.
For the most complete and objective view of the financial condition of the enterprise, it is necessary to pay attention to the complex of indicators and financial ratios of the company.
| Name, INN, region | Revenue, million RUB | Net profit (loss), million RUB | Liabilities to assets ratio (x), from 0,2 to 0,5 | Solvency index Globas | |||
| 2018 | 2019 | 2018 | 2019 | 2018 | 2019 | ||
| 1 | 2 | 3 | 4 | 5 | 6 | 7 | 8 |
| TATNEFT JSC INN 1644003838 Republic of Tatarstan |
|
|
|
|
|
|
173 Superior |
| JSC RUSSIAN RAILWAYS INN 7708503727 Moscow |
|
|
|
|
|
|
196 High |
| JSC MAGNITOGORSK IRON&STEEL WORKS INN 7414003633 Chelyabinsk region |
|
|
|
|
|
|
174 Superior |
| JSC SIBUR HOLDING INN 7727547261 Tyumen region |
|
|
|
|
|
|
194 High |
| LLC TOYOTA MOTOR INN 7710390358 Moscow region |
|
|
|
|
|
|
214 Strong |
| JSC SEVERSTAL INN 3528000597 Vologda region |
|
|
|
|
|
|
193 Superior |
| JSC ROSTELECOM INN 7707049388 Saint Petersburg |
|
|
|
|
|
|
267 Medium |
| JSC AEROFLOT-RUSSIAN AIRLINES INN 7712040126 Moscow |
|
|
|
|
|
|
195 High |
| LLC VOLKSWAGEN GROUP RUS INN 5042059767 Kaluga region |
|
|
|
|
|
|
210 Strong |
| JSC MEGAFON INN 7812014560 Moscow |
|
|
|
|
|
|
250 Medium |
| Average value for TOP-10 | |
|
|
|
|
|
|
| Average value for TOP-1000 | |
|
|
|
|
|
|
![]() growth of indicator to the previous period,
growth of indicator to the previous period, ![]() decrease of indicator to the previous period
decrease of indicator to the previous period
The average indicator of the net profit ratio of TOP-10 is below the average one of TOP-1000. In 2019, five companies have increased the value compared to the previous period.
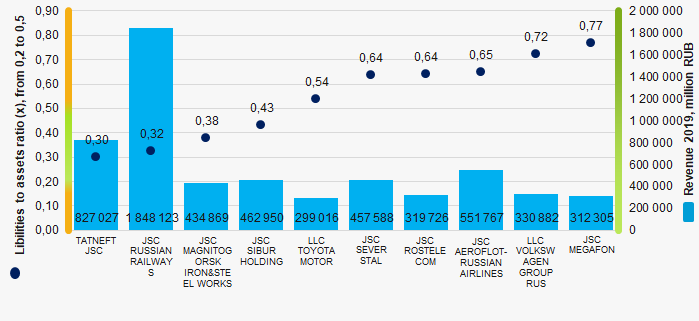 Picture 1. Liabilities to assets ratio of the largest Russian companies that received support from the government (TOP-10)
During six years, the average values of the liabilities to assets ratio of TOP-1000 have a positive trend to decrease (Picture 2).
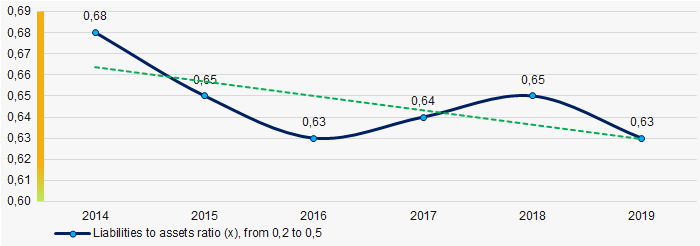 Picture 2. Change in the average values of the liabilities to assets ratio of TOP-1000 largest Russian companies that received support from the government, 2014 - 2019